
If you've spent any time running Amazon PPC campaigns, you've seen the term ACoS thrown around constantly. But most sellers either misread it or misuse it -and that mistake costs them real money.
Here's what actually happens: a seller checks their ACoS, sees 22%, decides things look fine, and keeps running the same campaigns. Meanwhile their margin is 19%. They're losing money on every single ad-driven sale - and they won't find out until they reconcile at the end of the month and wonder where the profit went.
This guide breaks down exactly what ACoS on Amazon means, how to calculate it, what a "good" number actually looks like for your business, and how to use it to make smarter advertising decisions. Not in theory. In practice.
What Is ACoS on Amazon?

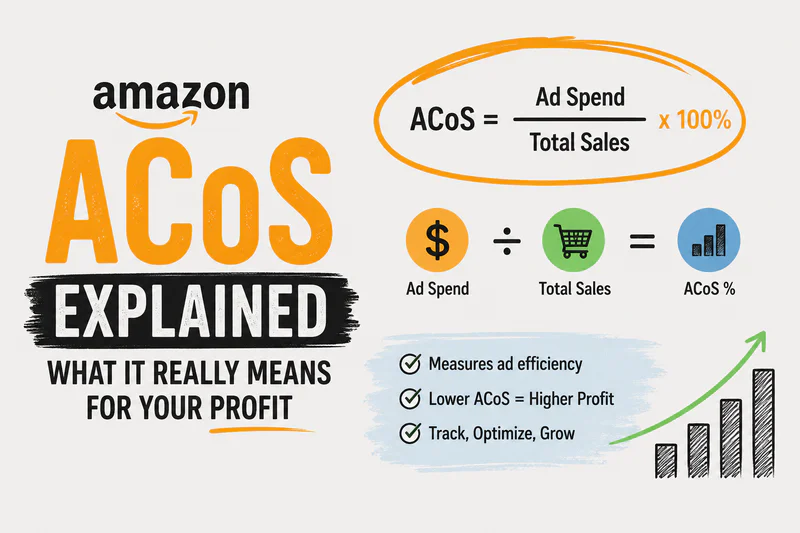
ACoS stands for Advertising Cost of Sales. It's Amazon's native metric for measuring how much you're spending on ads relative to how much revenue those ads generate.
In plain terms: for every dollar your ads bring in, ACoS tells you how many cents you spent to get it.
Amazon surfaces ACoS directly in Seller Central under your campaign reports, making it the go-to metric for evaluating PPC performance. But as you'll see, it only tells part of the story - and sellers who treat it as a complete picture consistently overpay for traffic or underinvest in campaigns that are actually working.
The ACoS Formula
ACoS = (Ad Spend ÷ Ad Revenue) × 100Example:
You spend $200 on a Sponsored Products campaign
That campaign generates $800 in sales
ACoS = ($200 / $800) × 100 = 25%
Simple enough. But the number only becomes meaningful when you compare it to your profit margins - which most sellers skip. A 25% ACoS is great if your margin is 40%. It's a slow bleed if your margin is 22%.
What Is a Good ACoS on Amazon?
There's no single "good" ACoS. The right number depends entirely on your margins and your goals. Anyone who tells you "aim for 15%" without knowing your product economics is giving you useless advice.
Break-Even ACoS
Your break-even ACoS is the point where your ad spend exactly cancels out your profit. Spend above it and you're losing money on every ad-driven sale. Stay below it and you're profitable.
Break-Even ACoS = Profit Margin %Example:
Your product sells for $40
COGS + FBA fees + other costs = $28
Gross profit = $12
Profit margin = 30%
Break-even ACoS = 30%
If your ACoS is 25%, you're profitable on ad sales. If it's 35%, ads are eating into your margin - $0.05 on every dollar of ad revenue goes toward a loss you're actively generating.
Target ACoS
Your target ACoS should sit below your break-even ACoS by enough to meet your profit goals. The gap between your actual ACoS and your break-even is your profitability buffer. Protect it.
The mistake most sellers make is chasing a low ACoS universally. A 10% ACoS on a product with a 12% margin still loses money. Context is everything.
ACoS vs TACoS: Why You Need Both
ACoS only measures revenue from clicks on your ads. It ignores organic sales - which means it can be deeply misleading when used alone.
TACoS (Total Advertising Cost of Sales) fixes that:
TACoS = (Ad Spend ÷ Total Revenue) × 100Total Revenue here includes both ad-attributed and organic sales.
Why TACoS matters more for profitability
Imagine you're spending $500/month on ads and generating $10,000 in total revenue ($4,000 from ads, $6,000 organic).
ACoS = $500 / $4,000 = 12.5% - looks great
TACoS = $500 / $10,000 = 5% - even better
Now flip the scenario. Same ACoS. But your organic sales drop from $6,000 to $2,000 when you pull back ad spend - because your ads were propping up your keyword ranking. Your ACoS looked pristine while your business was structurally dependent on paid traffic.
TACoS tracks this relationship over time - and tools that surface it alongside ACoS make the dependency visible before it becomes a crisis.
The signal to watch for: ACoS stays flat or rises slightly while TACoS falls over 60–90 days. That's your ads building organic rank - you're getting more revenue from the same spend. That's the compounding you want. If both rise together, you have an efficiency problem that needs to be fixed at the campaign level.
ACoS by Campaign Type: Sponsored Products vs Sponsored Brands vs Sponsored Display
Not all ACoS numbers are equal - and comparing ACoS across campaign types without context leads to bad decisions. Each campaign type serves a different function in your advertising mix.
Sponsored Products ACoS
This is your primary conversion driver. Sponsored Products ads appear directly in search results and on product pages. They have the tightest intent match - the shopper is actively searching - so they typically generate the lowest ACoS of the three types. This is where most of your ad budget should sit, and where your break-even ACoS math is most directly applicable.
If your Sponsored Products ACoS is above break-even, fix this first. Everything else is downstream of your core keyword efficiency.
Sponsored Brands ACoS
Sponsored Brands (formerly Headline Search) appear at the top of search results and drive traffic to your storefront or a custom landing page. They're visibility plays as much as conversion plays. ACoS on SB campaigns typically runs 20–40% higher than Sponsored Products - and that's expected. Evaluate SB campaigns against new-to-brand metrics and traffic data, not just raw ACoS.
Sponsored Display ACoS
Sponsored Display retargets shoppers who viewed your listing or similar products. Conversion windows are longer and intent is softer, so ACoS runs higher. Use Sponsored Display for brand defense, competitor conquest, and remarketing - not as a primary efficiency driver. Set a looser ACoS threshold here and evaluate it on view-through attribution as much as click-through.
Simple funda: set your ACoS targets at the campaign type level, not at the account level. A blended account ACoS that looks acceptable can be hiding a Sponsored Products problem masked by a low-spend Sponsored Display campaign - or vice versa.
How Your Product Lifecycle Should Change Your ACoS Target
Your ACoS target should not be static. It should move with your product - and sellers who don't adjust it by lifecycle stage consistently either overspend during maturity or underinvest during launch.
Launch Phase (0–90 days)
A new product has no organic rank, no review velocity, and no keyword history. Your conversion rate is lower. Your bids need to be higher to win impressions. ACoS will be above break-even - sometimes significantly. This is not a failure. It's the cost of building position.
The question isn't "is my ACoS too high?" during launch. The question is "am I gaining rank on the keywords that will drive organic sales at scale?" Track keyword position week over week. Watch your BSR trend. Those are your launch-phase metrics. ACoS becomes the primary lever later.
Growth Phase (90–180 days)
Reviews are building. Organic rank is improving. Conversion rate is rising. This is when you start pulling ACoS toward break-even - not by cutting bids blindly, but by moving proven converters to exact match, adding negatives aggressively, and letting auto campaigns feed you new keyword data at controlled spend.
Maturity Phase (180+ days)
Your ASIN has established rank. Organic contributes meaningfully to total sales. Here, your ACoS target should be comfortably below break-even - because you're no longer paying for rank, you're paying for incremental sales. Any ACoS above break-even at this stage is a structural problem: poor listing conversion, keyword misalignment, or price compression from competition.
The benchmark I use with brands at Adsify: by month 6, your ACoS should be at least 10 percentage points below your break-even. If it's not, the product has an economics problem - not an advertising problem.
Why ACoS Alone Can't Tell You If You're Profitable
Here's the trap every growing Amazon seller falls into at some point. They see a 20% ACoS and assume they're doing well. But if their margin is 18%, they're actually losing money on every single ad sale - and the payout reconciliation at the end of the month is a cold shower.
To know your real position, you need to layer ACoS on top of your actual unit economics:
Selling price (after Amazon's referral fee)
Cost of goods sold (COGS)
FBA fulfillment fees
Storage fees
Returns rate
Other overhead (prep, software, VA costs)
Only when you know your true net margin can you set a meaningful ACoS target. This is exactly why profit analytics tools matter - manually tracking all these inputs across dozens of SKUs every week isn't realistic, and the sellers who try to do it in spreadsheets are always working with stale numbers.
Common ACoS Mistakes Amazon Sellers Make
1. Using the same ACoS target for all products
Each product has different margins. A 30% ACoS might be fine for a high-margin supplement but catastrophic for a low-margin accessory. Set targets per ASIN, not per account.
2. Optimizing ACoS without watching TACoS
Cutting bids aggressively to lower ACoS can crater your organic rank, tanking total revenue even as your ACoS "improves." You fixed the metric. You broke the business.
3. Ignoring ACoS during a launch
New products need aggressive bidding to gain reviews and ranking. A high ACoS during launch is often an investment, not a failure. The mistake is not having a defined window for when that investment phase ends.
4. Not accounting for attributed vs. actual conversions
Amazon's 14-day attribution window means some "ad sales" would have happened organically. Your real ACoS impact may be lower than it appears - particularly on branded keyword campaigns where you're largely capturing demand you'd have gotten anyway.
5. Treating ACoS as a standalone profit metric
ACoS doesn't include FBA fees, COGS, or returns. A product can have a stellar ACoS and still bleed money at the unit level. This is one of the most common Amazon FBA mistakes sellers make when evaluating their ad performance - and it's invisible until you run a proper unit P&L.
How to Lower ACoS Without Killing Sales
If your ACoS is above your break-even, here's where to start - in order of impact:
Audit your search term report first
Identify search terms with high spend and zero or low conversions. Add them as negatives immediately. This is the highest-leverage action for reducing wasted spend — and most sellers only do it quarterly when it should be a weekly discipline. Every dollar you stop wasting on non-converting terms is a dollar that improves your ACoS without touching a single bid.
Tighten match types on proven converters
Broad match keywords cast a wide net - useful for discovery but expensive for efficiency. Shift proven performers to phrase or exact match to improve relevance and reduce irrelevant clicks. Keep a small broad match budget running for keyword discovery, but don't scale it until a term proves conversion history.
Fix your listing conversion rate
ACoS is partly a function of how well your listing converts. A listing converting at 8% on the same traffic as a listing converting at 15% will have roughly double the ACoS - same bids, same clicks, half the sales. Better main images, a cleaner title with the right keyword placement, and bullet points that answer objections directly will move your conversion rate - and your ACoS follows automatically.
Use bid scheduling where the data supports it
If your campaign data shows consistent patterns of low conversion during specific hours or days, reduce bids during those windows. Don't assume - verify with at least 30 days of hourly data before changing bid schedules. Premature dayparting based on insufficient data creates more problems than it solves.
Segment campaigns by performance tier
Don't let high-performing and low-performing keywords share the same campaign budget. Separate them so you can apply different bid strategies, budgets, and targets without compromise. Your top-converting exact match terms should have their own campaign with uncapped budget during peak hours. Your discovery broad match campaigns should have strict daily budget limits.
What ACoS Benchmarks Look Like by Category
While every product is different, here are rough ACoS ranges sellers typically target across Amazon US categories. Use these as context - not as your target:
These are starting points, not rules. Your break-even ACoS is the only benchmark that truly matters for your business. A Home & Kitchen seller with a 45% margin can run a 38% ACoS profitably. A Beauty seller with a 20% margin can't survive a 25% ACoS regardless of what the category average says.
How Often Should You Actually Review ACoS?
Most sellers either check ACoS daily (too reactive) or monthly (too slow). Neither cadence gives you useful signal.
Daily ACoS data is noisy. A single low-volume day can spike your ACoS 15 points and prompt a bid cut that was completely unnecessary. Amazon's attribution model also means some conversions from today's clicks won't show up for 24–72 hours - so same-day ACoS is structurally incomplete.
Monthly is too slow to catch a problem before it costs you real budget. A campaign running above break-even for 30 days on a $3,000/month ad budget is a $300–500 avoidable loss before you even see it.
The cadence I use: weekly reviews at the campaign level, bi-weekly at the keyword level. Weekly is long enough to have statistically meaningful data and short enough to catch drift before it compounds. Bi-weekly on keywords gives you enough conversion data to make bid decisions that aren't just noise.
One exception: during a launch, check daily - but only to watch budget pacing and keyword position, not to make bid changes. Make bid decisions weekly even during launch.
A Real-World ACoS Walkthrough
Let's make this concrete. Here's an actual scenario I see regularly.
A seller is running a $35 Home & Kitchen product. Their costs break down as:
Selling price: $35.00
Amazon referral fee (15%): $5.25
FBA fulfillment fee: $4.50
COGS: $9.00
Storage + other costs: $1.50
Net margin: $14.75 (42.1%)
Break-even ACoS = 42.1%. They have significant room.
Their Sponsored Products ACoS is running at 28% - comfortably below break-even. But their account-level blended ACoS looks like 34% because Sponsored Display is running at 65% ACoS on a retargeting campaign they set up 6 months ago and forgot to cap.
The fix is not "lower ACoS across the board." The fix is: pause or restructure the Sponsored Display campaign, tighten the budget cap, and let Sponsored Products - which is actually performing - run freely. Account-level ACoS drops to 29% without touching a single Sponsored Products bid.
That's the difference between optimizing the metric and understanding the business.
ACoS as a Profitability Signal — Not a Target
ACoS is a signal, not a verdict. Used correctly, it tells you:
Whether your ad campaigns are running efficiently
Which keywords are worth scaling and which are burning budget
How aggressively you can bid while staying profitable
Whether your listing conversion rate is helping or hurting your ad economics
Used in isolation, it misleads you into thinking you're profitable when you're not - or prompts you to cut spend that's actually driving valuable organic rank and long-term growth.
The sellers who win on Amazon aren't chasing a low ACoS. They're chasing a healthy gap between their ACoS and their break-even - and they track that gap at the SKU level, not just across their whole account. That gap is your actual margin of safety. Know it on every ASIN. Protect it.
Track What Actually Moves the Needle
Understanding ACoS is step one. The harder part is tracking it accurately across every product, campaign, and cost input in real time - without building a new spreadsheet every week.
That means knowing your true margin on each ASIN, syncing your ad spend against actual net profit, and spotting when ACoS trends start moving against you before they become a problem at the payout stage.
The sellers who do this consistently - weekly reviews, ASIN-level P&L, campaign-type segmentation - are the ones building Amazon businesses that hold margin as they scale. The ones who don't are often profitable on paper and bleeding in practice.
Sellerview surfaces your ACoS and TACoS alongside actual unit-level margin - so you know at a glance whether your ad spend is working for you or against you, on every product, every week. Not in a spreadsheet you built three months ago. In real time.