
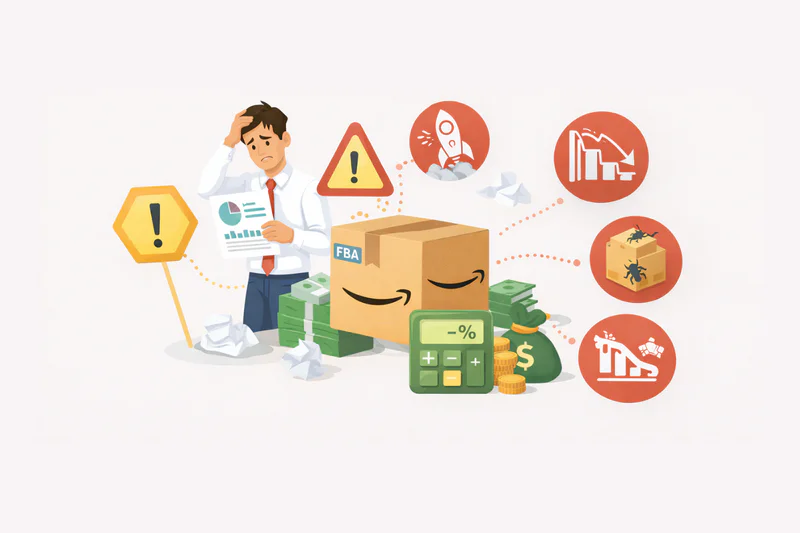
You pulled your Seller Central report last month. Revenue: $85,000. You felt good — until you actually looked at your bank account. Something didn't add up. You ran the numbers three times. Turns out, after FBA fees, PPC spend, returns, and storage costs, you netted $4,200. That's a 4.9% margin on six figures of revenue.
That's not a bad month. That's a broken business model — and the scariest part? Most sellers don't even know it's happening until it's too late.
I've seen this across hundreds of brands at Adsify. The pattern is always the same: revenue trending up, bank account telling a different story. These are the Amazon FBA mistakes that quietly drain your profit while your revenue dashboard keeps looking great.
Key Takeaways
Blended P&L hides loss-making SKUs. Your hero product can mask 2–3 ASINs bleeding you dry.
ACoS tells you ad efficiency. TACoS tells you ad dependency. Most sellers optimize the wrong metric.
The honeymoon period is your best organic window — most sellers waste it entirely.
Scaling ad spend before hitting a social proof threshold burns cash at scale.
Return rate is a P&L line item, not a customer service issue.
Post-shipment leaks — lost inventory, inbound fees, shipment discrepancies — cost sellers thousands they never reclaim.
Table of Contents
Ignoring FBA Fees Until They Eat Your Margin
Poor Keyword Research and the ACoS Trap
The SKU-Level P&L Blindness Problem
Wasting the Honeymoon Period
Scaling Ads Before You Have Social Proof
Inventory Mismanagement: Stockouts and Storage Fee Traps
The Post-Shipment Money Leak Nobody Talks About
1. Ignoring FBA Fees Until They Eat Your Margin
You listed a product at $29.99. Your landed COGS is $8. That's a 73% gross margin — or so you thought.
Then reality hits:
Referral fee: ~15% = $4.50
FBA fulfillment fee: ~$3.22 (standard size, light item)
PPC spend per unit: $3.50 (at a modest $15 ACoS)
Return allowance: $0.80
Storage fee: $0.40/unit/month
That's $12.42 in costs on top of your $8 COGS. Your actual margin: $9.57 on a $29.99 sale = 31.9%. Before taxes, before overhead, before account fees.
If you're in a higher-fee category or running an oversized item, those numbers get worse fast. Amazon's referral fees range from 8% to 45% depending on category — and the difference between a 15% and a 20% referral fee on a $30 product is $1.50 per unit. That doesn't sound like much. Across 3,000 units a month, that's $4,500 you didn't account for.
Most sellers know this in theory. Almost none build it into their SKU-level economics before launch. They see a healthy-looking COGS-to-price ratio, assume the margin is there, and start sourcing. By the time the real numbers show up, they're already committed to 500 units in the warehouse.
To understand what a sustainable margin actually looks like at different price points and categories, read our breakdown of what's a normal Amazon FBA profit margin after fees and ads. The benchmarks might surprise you.
The Fix
Model every SKU's true unit economics before you source. COGS + all Amazon fees + ad spend per unit + return rate + storage = real margin. If that number isn't at least 20–25%, reconsider the product. Not the price. The product.
2. Poor Keyword Research and the ACoS Trap
Targeting high-volume keywords sounds smart. It isn't — not without buy intent behind them.
"Yoga mat" gets 150,000 searches a month. "Non-slip thick yoga mat for hot yoga" gets 4,200. If you're a new seller, you know which one you should be bidding on. The high-volume keyword goes to brands with 5,000 reviews and Prime badges. The long-tail keyword is where you can actually compete, convert, and build rank.
But keyword selection is only half the problem. The bigger mistake is optimizing ACoS while ignoring TACoS — and most articles don't explain the difference properly.
ACoS vs TACoS: The Framework You're Probably Missing
ACoS tells you how efficient your ads are. TACoS tells you how dependent your business is on ads to generate any revenue at all.
You can have a "good" ACoS of 18% while your TACoS is 35% — which means more than a third of every dollar you make goes straight back to Amazon in PPC. That's not a scaling business. That's a treadmill. And the only way off the treadmill is building organic rank — which only happens if your keyword strategy is actually working.
If your TACoS isn't trending down over time as organic rank improves, your ads are sustaining sales, not creating leverage. Here's a deeper breakdown of how TACoS works and why it matters more than ACoS for long-term profitability.
3. The SKU-Level P&L Blindness Problem
This is the most expensive Amazon FBA mistake on this list — and the least talked about.
Your account looks fine. Revenue is up. Overall margin is 18%. You reinvest, scale, hire a VA. Then one day you actually break down your P&L by SKU and find: one hero ASIN is doing 70% of your revenue at 28% margin. The other three are running at 4%, -2%, and 6%.
Blended P&L hides this completely. And Seller Central's default reporting is built for Amazon's accounting — not yours. It gives you category-level and account-level views. It does not give you SKU-level profitability. That's a deliberate design choice, not an oversight.
The SKU-Level P&L Framework
For every ASIN, you need visibility on:
COGS (per unit, fully landed — including freight, duties, prep)
Amazon fees (referral + FBA, by ASIN — these vary by size tier and category)
PPC spend (per ASIN, not blended account level)
Return rate (your ASIN vs category average)
Storage costs (especially for slow movers sitting past 90 days)
Net margin per unit sold
Once you have that, the answer becomes obvious. You kill the -2% ASIN, pause the 4% until you can renegotiate COGS, and pour resources into the 28%. Instead, most sellers continue scaling the whole account because the blended number looks "okay."
Sellerview pulls all of this into one dashboard per SKU so you can see exactly which products are making you money and which are quietly killing you - without building it manually in a spreadsheet every month.
Start by running your product numbers through our amazon profit calculator plug in your COGS, fees, and ad spend to see your real unit margin before you scale.
The rule: never scale an ASIN you haven't profiled at the unit level.
4. Wasting the Honeymoon Period
Amazon gives every new ASIN a launch window — commonly called the honeymoon period — where the algorithm is watching closely to determine long-term rank. During this window, your click-through rate, conversion rate, and early sales velocity carry disproportionate weight in the ranking signals.
Most sellers waste it. They launch with an unoptimized listing, zero reviews, and underfunded or poorly-targeted PPC. You get one shot at this window. Once it closes, clawing back organic rank costs 3–4x more in ad spend than if you'd gotten it right at launch.
What a Proper Launch Looks Like
Listing fully optimized before going live: A+ content, keyword-rich title, professional images, complete backend search terms
At least 5–10 reviews secured via Vine or early purchaser outreach before scaling ads
Day-one PPC with exact-match bids on your 10–15 highest-intent keywords
Aggressive early pricing (or promotions) to drive conversion rate above category average
Daily monitoring of search term reports in the first 3–4 weeks — add negatives fast, double down on what's converting
The honeymoon period is your cheapest path to organic rank. Treat it like a product launch event — not a soft open where you figure it out as you go.
5. Scaling Ads Before You Have Social Proof
This is the mistake that burns the most cash for new ASINs.
At 0 reviews, your conversion rate might be 4–6% on a good listing. At 15–20 reviews, that number typically jumps to 10–14%. At 50+ reviews, you're in a different league entirely. The shopper's decision-making changes completely once social proof is present.
Here's what that means in real money:
Illustrative estimates based on typical category benchmarks.
Scaling to $5K/month in PPC with 3 reviews isn't aggressive. It's wasteful. The shopper clicks, sees no social proof, and bounces to your competitor who has 200 reviews at the same price. You paid for that click and got nothing.
Every dollar you spend in ads at low review counts is a dollar you'll spend again more efficiently once you've built the moat. Sequence matters.
The threshold rule: Don't scale ad spend past $50/day until you have at least 15 reviews. Build the moat first, then open the floodgates.
6. Inventory Mismanagement: Stockouts and Storage Fee Traps
Both extremes cost you money — just in different ways.
Stockouts kill your organic rank. Amazon's algorithm interprets zero inventory as low demand. Rebuilding rank after a stockout can cost weeks of elevated PPC spend — sometimes months. The BSR you earned through months of consistent sales can drop precipitously in days.
Overstock triggers long-term storage fees. Amazon charges based on cubic footage for inventory stored over extended periods — and aged inventory surcharges kick in well before the 365-day mark for slow movers. If you're paying $1.50–$6.90 per cubic foot on dead inventory every month, those costs compound fast and don't show up obviously in your blended P&L.
The Fix
Use 60–90 day sell-through rates by ASIN to set reorder points. Don't manage inventory at the account level — manage it at the SKU level. A fast mover and a slow mover need completely different reorder logic, different safety stock levels, and different supplier lead time assumptions.
For seasonal products: model the storage cost of carrying inventory through off-season against the risk of stocking out at peak. One number will be obviously larger. Plan around the larger risk, not the smaller one. If your peak season is Q4 and storage fees spike in October–December, your inventory math needs to account for both the fee increase and the revenue loss from a stockout simultaneously.
Creation of removal orders on aged, slow-moving inventory is an active decision, not a last resort. If a SKU has been sitting 120+ days and the sell-through isn't improving, a removal order is cheaper than continuing to pay storage on inventory that's becoming a liability.
7. The Post-Shipment Money Leak Nobody Talks About
Every article focuses on pre-sale mistakes. Almost none talk about what happens after your inventory ships to Amazon — and that's where a surprising amount of money disappears quietly.
Three specific leaks most sellers ignore:
1. Inbound placement fees. Amazon's inbound placement policy charges fees when you send inventory to a single fulfillment center instead of splitting across their network. If you're not accounting for inbound placement fees in your unit economics upfront, your landed cost per unit is understated. These fees are real, they're charged at shipment time, and they vary by SKU and destination.
2. Lost and damaged inventory. Amazon loses or damages inventory regularly. You're entitled to reimbursement — but Amazon won't automatically pay you. You have to identify the discrepancy, file a claim, and follow up. Most sellers either don't know this or don't have a process to catch it systematically. This is invisible money sitting on the table. A $100K/month seller who isn't actively reconciling can easily leave $800–$2,000/month unclaimed.
3. Return costs and shipment reconciliation. What you send vs what Amazon receives vs what gets counted in your available inventory are three different numbers — and they don't always match. Amazon does charge for returns in ways most sellers don't fully map out — restocking fees, return processing fees, and reimbursement disputes on items marked as customer-damaged but never returned to sellable inventory. Reconciling these regularly is a real operational task that most sellers skip entirely.
Combined, these three leaks can cost a $100K/month seller $2,000–$4,500/month in uncaptured losses. That's money you earned but never collected.
FAQ
What are the most common Amazon FBA mistakes for new sellers?
The top mistakes: underestimating FBA fees before sourcing, launching with no reviews and underfunded PPC, targeting high-volume keywords with no buying intent, and skipping SKU-level P&L tracking. Most new sellers focus on revenue. The ones who scale profitably obsess over unit economics from day one.
What is a good Amazon FBA profit margin?
A healthy Amazon FBA profit margin is 20–30% net after all fees, PPC, COGS, and returns. Under 15% leaves no room for error. Under 10% is typically unsustainable once you factor in overhead, account fees, and capital costs. The benchmark shifts by category — commodity products with thin margins need volume to survive; differentiated products should be targeting 25%+.
Is Amazon FBA worth it in 2026?
Yes — if you run it like a real business. Is Amazon FBA worth it for someone who ignores unit economics and flies blind on P&L? No. The sellers winning right now have precise cost visibility per SKU, not just the highest revenue numbers. The platform is competitive, but the competitors who understand their real margins will outlast those who don't.
Is Amazon FBA profitable without PPC?
Increasingly difficult. Organic visibility alone is hard to maintain in competitive categories. The question isn't whether to run PPC — it's whether your unit economics support the ad spend. If your margin can't absorb 15–20% TACoS, the product economics need rework before you scale ads.
What is TACoS and why does it matter more than ACoS?
TACoS (Total Advertising Cost of Sale) = ad spend ÷ total revenue. It shows your ad dependency, not just ad efficiency. A declining TACoS means your organic is growing and your ads are creating leverage. A flat or rising TACoS means you're paying for every sale indefinitely — which is not a scalable business model.
How do I find out which of my SKUs are losing money?
Break your P&L down by ASIN: COGS, FBA fees, referral fees, PPC per ASIN, return costs, storage. Blended account-level reports hide this. Tools like Sellerview do this automatically, giving you real-time SKU-level profit visibility without building it manually in a spreadsheet every week.
Stop Flying Blind on Your FBA Profit
None of these mistakes are obscure. They're hiding in plain sight — in blended reports that look fine, in fee schedules nobody reads carefully, in post-shipment discrepancies nobody reconciles. The sellers who catch them early build durable, profitable businesses. The ones who don't keep reinvesting into a margin problem that compounds over time.
You now know what's costing you money. The question is whether you'll keep managing your business off blended reports — or get actual visibility.
Sellerview shows you exactly where your money is leaking: fees, PPC, returns, storage — broken down by SKU, in real time. No more spreadsheets. No more surprises at the end of the month.
Try Sellerview free — see your true profit in minutes →