
Your Amazon Profit Calculator Showed a 22% Margin - Your Returns Just Deleted Half of It
You ran the numbers through your Amazon profit calculator before launch. Referral fee, FBA fee, COGS, storage - all accounted for. Margin looked healthy. You launched, scaled ads, and started selling.
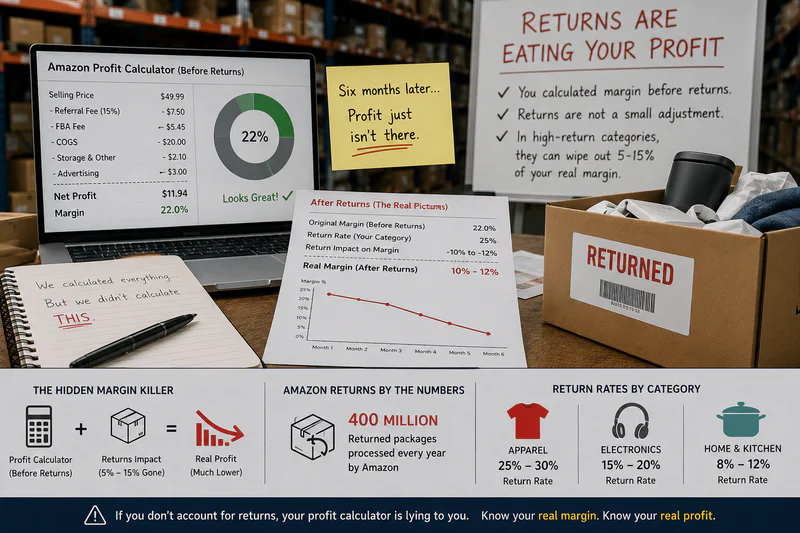
Six months later, the profit just is not there.
Here is what happened. Your Amazon profit calculator calculated your margin before returns. Not after. And depending on what category you sell in, returns are not a small adjustment - they are a category-defining cost that can wipe 5-15% off your real margin before you even notice it is gone.
Amazon processes around 400 million returned packages every year. That volume does not distribute evenly. Apparel sellers see 25-30% return rates. Electronics sellers face 15-20%. Home and Kitchen runs 8-12%. If you are in the high-return categories, your Amazon profit calculator is showing you a number that is simply wrong.
Why Your Amazon Profit Calculator Does Not Show You the Real Return Cost
Amazon's free Revenue Calculator asks for your selling price, COGS, and shipping. It outputs referral fees, FBA fulfillment fees, and a per-unit profit estimate. Returns are not in that calculation by default.
Most third-party Amazon profit calculators do not include returns either. They show you gross unit economics - what the product earns on a clean sale. But Amazon does not sell clean. Every category has a return rate, and every return has a cost structure most sellers underestimate.
Here is what a single return actually costs you:
• The refund to the customer - full selling price in most cases
• Amazon's return processing fee - charged per unit on categories with free returns
• Restocking and repackaging - if the item comes back sellable, you still pay to reprocess it
• Lost inventory value - if the item returns damaged or opened, you take the full COGS loss
• Lost ad spend - you already paid for the clicks that led to the return
The real cost of a return is not just the refund. It is the refund + processing fee + ad spend already spent + potential inventory write-off.
On a $45 product, a single return can cost you $12-18 once you factor everything in. Your Amazon profit calculator showed you $8.50 profit per unit. One return effectively cancels out 1.5-2 clean sales.
Amazon Return Rates by Category - What Your Amazon Profit Calculator Should Be Using
These are 2026 benchmarks. Use them to set realistic return rate assumptions in your profit calculations - category by category.
Run these benchmarks through your Amazon profit calculator every time you enter a new category or launch a new SKU. A 22% gross margin in electronics with a 15% return rate does not stay at 22%. It lands closer to 12-14% after real return costs. That is the gap between thinking you are profitable and actually being profitable.
How to Add Return Costs Into Your Amazon Profit Calculator
Here is the formula most sellers should be running but are not:
Adjusted Net Profit = (Revenue x (1 - Return Rate)) - (COGS x Units Sold) - FBA Fees - Ad Spend - (Return Rate x Return Processing Cost Per Unit) - Storage
Let us make it concrete. You sell a $45 fashion item with a $13 COGS.
That is 7.8 percentage points of margin your Amazon profit calculator never showed you. Scale to 500 units per month: 125 returns at $14 each = $1,750 per month in hidden losses. Across 12 months - $21,000 in untracked costs on a product you thought was profitable.
Same Return Rate, Different Margin Damage - The Category Nuance
A 10% return rate does not hurt all categories equally. In Home and Kitchen, where net margin runs 25-35%, a 10% return rate shaves roughly 2-4 percentage points off margin. Painful, but survivable.
In Electronics, where net margin is already 8-15%, a 10% return rate can cut your real margin in half. You were at 12% gross. After returns, you are at 5-6%. After storage and any ad spend inefficiency, you are barely above zero - or below it.
This is why category selection is a margin decision, not just a product decision. Electronics sellers who do not factor return rates into their Amazon profit calculator often think they have a 12% margin business. They actually have a 4% margin business one fee change away from selling at a loss.
Categories with structural return risk - apparel, footwear, electronics - need a higher gross margin buffer before returns. If your gross margin in these categories is under 30%, returns will likely push your real margin below 10%.
3 Actions to Take Once You Know Your Real Return-Adjusted Margin
1. Set a Return Rate Threshold Per SKU
Pull your return rate per ASIN from Seller Central's Returns Report monthly. Set a threshold - 12% for low-margin categories, 20% for high-margin categories. If a SKU crosses the threshold for 2 consecutive months, it triggers an immediate review: listing audit, review analysis for recurring complaints, and a pricing check.
2. Fix the Listing Before Touching Ad Spend
Most return rate spikes come from one of three things: sizing or fit expectations not met (apparel/footwear), product descriptions that oversell features (electronics), or images that do not show actual scale or colour (home and kitchen). A listing fix costs nothing and takes a week to test. If your return rate is above category benchmark, fix the listing first - every time.
3. Update Your Amazon Profit Calculator With Return-Adjusted Numbers Monthly
Return rates shift as reviews accumulate, listings change, and seasons move. A fashion SKU in December runs different return rates than the same SKU in July. Run return-adjusted calculations monthly - not just at launch. sellerview.AI tracks return rates per ASIN automatically alongside your full P&L, so you see the real margin without pulling data from 4 different Seller Central reports.
Your Amazon Profit Calculator Is Pre-Return. Your Real Margin Is Post-Return.
The gap between those two numbers is where most Amazon sellers lose money without realizing it.
25-30% return rates in apparel, 15-20% in electronics - these are not edge cases. They are the norm for those categories. And every return costs more than just the refund.
Run your category's real return rate through your Amazon profit calculator. If your margin shrinks below 10% after that adjustment, you do not have a margin business. You have a return management problem.
sellerview.AI tracks your real return rate per SKU automatically - alongside FBA fees, ad spend, and net margin. See what returns are actually costing you → free to start.
FAQ: Amazon Profit Calculator and Return Rates by Category
Does the Amazon profit calculator include return rates in its calculation?
No. Amazon's free Revenue Calculator calculates per-unit profit based on referral fees, FBA fulfillment fees, and your COGS. Return costs - refund amount, return processing fee, and potential inventory damage - are not included by default. You have to add return rate assumptions manually to get a realistic margin figure. Most sellers skip this and discover the gap when their monthly profit does not match what the calculator showed.
What is the average Amazon return rate by category in 2026?
Apparel and footwear sit at the top with 25-30% return rates. Electronics follow at 15-20%. Home and Kitchen runs 8-12%, beauty and health products stay low at 4-12%, and books hold the lowest rates at 2-5%. Return rates are primarily driven by fit expectations, product complexity, and Amazon's return policy per category.
How much does a return actually cost an Amazon FBA seller in 2026?
A typical return on a $35-$45 product costs $12-18 in total once you factor in the customer refund, Amazon's return processing fee, repackaging or restocking cost, and the ad spend already allocated to that sale. If the item returns damaged, add the full COGS loss. Most Amazon profit calculators show only the refund amount, which significantly understates the real cost per return.
Which Amazon categories have the lowest return rates in 2026?
Books and media (2-5%), supplements and grocery (5-7%), and health and household products (5-8%) consistently have the lowest return rates. These categories benefit from hygiene restrictions on returns, consumable nature, and clear product expectations. Beauty products also stay low at 4-12%. If return rate risk is a concern, these categories offer the most margin protection.
How do I add return costs into my Amazon profit calculator?
Multiply your category's return rate by the total cost per return (refund + return processing fee + repackaging if applicable). Divide this by total units sold to get a per-unit return cost allocation. Subtract this from your gross profit per unit to get your real post-return margin. For a 25% return rate and $14 cost per return, subtract $3.50 from each unit's profit - that is your real number.