
Here is your Free Amazon Profit Calculator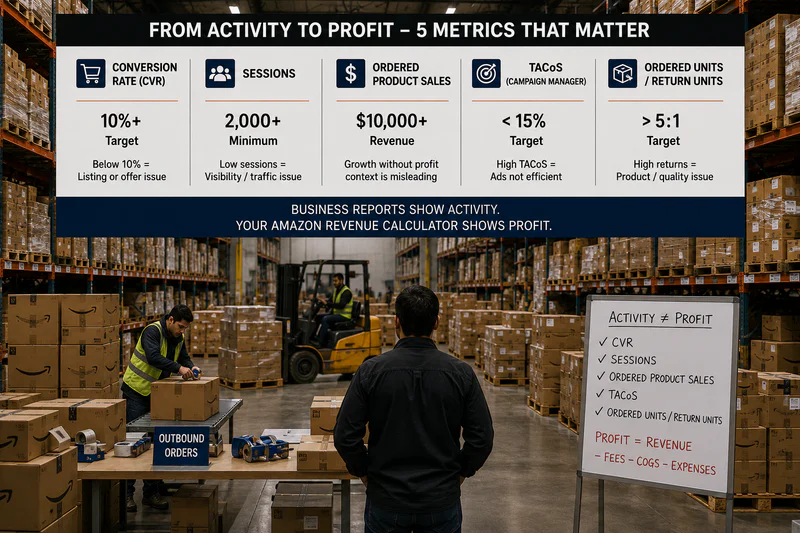
Amazon Business Reports show traffic and revenue data. Your amazon revenue calculator shows what that revenue actually earns after fees and COGS. The 5 metrics that matter when you read these reports together are: conversion rate (CVR), sessions, ordered product sales, TACoS (from Campaign Manager), and ordered units divided by return units. Reading Business Reports without running them through your amazon revenue calculator gives you activity data with no profit context - and activity without profit context is how sellers mistake revenue growth for business growth.
What you will learn in this post:
• The 5 Business Report metrics that connect directly to your amazon revenue calculator output - and what action each one triggers
• Why Business Report revenue numbers mislead most sellers - and how to use your amazon revenue calculator to add profit context to every metric
• The conversion rate threshold (10%) and sessions-to-sales ratio that separate healthy product performance from invisible problems
Your Amazon Revenue Calculator Showed Profit Down. Your Business Report Showed Revenue Up.
Sessions: 3,200. Ordered product sales: $47,400. Units ordered: 342. Buy Box percentage: 89%. You look at this every week. Revenue is up 12% from last month. You feel good.
But your amazon revenue calculator tells a different story. Net margin on the same SKU: 8.2%. Down from 11.4% last month. Why? FBA fees increased. Return rate crept up. TACoS rose to 19%.
The Business Report showed revenue growing. The amazon revenue calculator showed profitability declining. They both used the same transactions. The difference is what you were measuring.
After working with 300+ Amazon brands across Home & Kitchen, Beauty, and Electronics, the pattern is always the same: sellers read Business Reports as a progress report. Revenue up is good. Revenue down is bad. What they are missing is the link between those revenue numbers and what they actually earn - which is what the amazon revenue calculator provides.
What Is the Amazon Business Report and How Does It Relate to the Amazon Revenue Calculator?
The Amazon Business Report is a Seller Central reporting section that provides per-ASIN traffic, conversion, and revenue data - including sessions, page views, buy box percentage, ordered units, and ordered product sales. It shows the demand side of your business. The amazon revenue calculator shows the economics side - what each unit of demand actually earns after referral fees, FBA fees, COGS, and ad spend. Neither is complete without the other. Business Reports tell you what is happening. The amazon revenue calculator tells you whether what is happening is profitable.
The 5 Business Report Metrics That Connect to Your Amazon Revenue Calculator
Metric 1: What does my conversion rate tell me and what should I do with it?
Conversion rate (CVR) in Amazon Business Reports = Units Ordered / Sessions x 100. This is the most direct measure of listing effectiveness. When CVR drops, every session becomes less valuable - and your amazon revenue calculator margin effectively falls because you are paying the same FBA fees and ad spend per session but converting fewer sales.
A well-optimised listing in a competitive category typically converts at 10-15%. Below 10% on a mature product (live 90+ days) signals a listing quality problem. Below 7% signals a fundamental mismatch between your listing and search intent, review score below 4.0 stars, or pricing above market. Check your amazon revenue calculator margin at current CVR. If CVR improves from 7% to 12% - the same ad spend produces 71% more units. That is margin improvement without touching a single fee.
Benchmark: Seller Fulfilled and FBA products average 7-10% CVR platform-wide. FBA products with 50+ reviews and 4.5+ stars target 12-18%. Any product below 5% CVR is paying for traffic that is not converting - fix listing quality before spending another dollar on ads.
Metric 2: What does my sessions trend tell me about organic health?
Sessions in Business Reports measures unique visits to your product detail page. Unlike traffic on other platforms, Amazon sessions tie directly to search rank and Buy Box status. Falling sessions without a corresponding ad spend reduction means organic rank is declining - often the result of sales velocity slowdown, increasing competition for your top keywords, or negative review accumulation.
Your amazon revenue calculator does not show sessions. But the connection is direct: fewer sessions at the same CVR means fewer sales, which means lower total revenue while fixed costs (FBA fees, placement fees, storage) remain proportionally the same. Falling sessions push up your per-unit cost structure even if nothing about your amazon revenue calculator inputs changes. Track sessions weekly. If sessions drop more than 15% week over week without a seasonal explanation or inventory change, organic rank is deteriorating.
Metric 3: How do I use Ordered Product Sales alongside my amazon revenue calculator?
Ordered Product Sales is your gross revenue before any deductions. It is the top line. Every seller monitors it. The problem is monitoring it without dividing by the amazon revenue calculator net margin percentage - which tells you how much of that revenue you actually keep.
Quick diagnostic: Ordered Product Sales x Net Margin % (from amazon revenue calculator) = estimated net profit for the period. If Ordered Product Sales is $47,400 and net margin is 8.2%, estimated net profit = $3,887. If you thought revenue growth meant profit growth but net margin compressed from 11.4% to 8.2% - you earned $894 less this month despite earning $5,400 more in revenue. Revenue grew 12%. Profit fell 19%. Business Reports alone never showed you this. The amazon revenue calculator did.
Metric 4: What is my unit return rate from Business Reports and what action does it trigger?
Amazon Business Reports do not show return rate directly. Calculate it by pulling the Customer Returns report separately: Units Returned / Units Ordered x 100 for the same period. Return rate is one of the fastest-moving margin drivers in your amazon revenue calculator - and it is invisible in the main Business Report view.
In 2026, return processing fees apply per returned unit above category-specific thresholds - or on every returned apparel and shoe unit with no threshold. A return rate increase from 6% to 11% on a 300-unit product in Home & Kitchen adds approximately $150-$250/month in return processing fees that never appear in your Business Report revenue figure. They appear in your amazon revenue calculator margin and your Payments report. Check return rate monthly. If it increases more than 3 percentage points, pull your Voice of the Customer data for the root cause before assuming it is a product defect.
Metric 5: What is my Buy Box percentage and when does it directly affect my amazon revenue calculator output?
Buy Box percentage in Business Reports is the share of page views where your listing held the Buy Box. Lose Buy Box and sales velocity drops immediately - CVR falls because customers cannot add your product to cart from the main listing button. If Buy Box percentage drops below 80%, something has changed: a competitor may have undercut your price, Amazon may have entered the listing, or your seller metrics may have dipped.
Buy Box loss directly compresses your amazon revenue calculator output. Fewer sales from the same sessions means the same fixed costs absorb against fewer units - pushing per-unit economics worse. Monitor Buy Box weekly. If it drops below 80%, check pricing versus Buy Box winner, check your Seller Performance metrics (ODR, cancellation rate, late shipment), and check whether Amazon has begun selling the same product.
The Amazon Revenue Calculator + Business Report Dashboard: What to Check Monthly
Sellers Reconciling Their Business Report Against the Amazon Revenue Calculator Find 1-3% of Revenue in Missed Reimbursements
One specific use case where Business Reports and the amazon revenue calculator produce a gap that is actually recoverable cash: FBA reimbursements.
Sellers who reconcile Amazon settlement reports against their Business Report revenue data recover an average of 1-3% of revenue in missed reimbursements per quarter - from lost or damaged inventory, incorrect fee charges, and unprocessed customer refund reversals. On $47,000/month in revenue, that is $470-$1,410 per month in cash that Amazon owes but has not paid without a claim.
This reconciliation cannot happen from Business Reports alone. It requires cross-referencing against your settlement reports and using your amazon revenue calculator to flag when per-unit profitability shows unexplained compression that is not explained by fee changes or COGS movement.
How to Build a 30-Minute Monthly Review Using Business Reports and Your Amazon Revenue Calculator
Here is the practical process. One 30-minute session per month produces all five signals:
• Pull Business Reports > Detail Page Sales and Traffic (by ASIN). Record sessions, CVR, Buy Box %, and Ordered Product Sales for each SKU. Compare to prior month.
• Pull Customer Returns report. Calculate return rate per ASIN (units returned / units ordered x 100). Compare to prior month.
• Run your amazon revenue calculator for each active SKU with full 2026 costs: landed COGS, referral fee, FBA fee, placement fee ($0.40/unit standard), return rate allocation, storage. Record net margin.
• Pull TACoS per SKU from Campaign Manager: total ad spend / total revenue (from Business Reports) x 100.
• Calculate real net margin: amazon revenue calculator pre-ad margin minus TACoS. If this number is below 10% and declining - investigate root cause using the metric table above.
This review surfaces the actionable information buried in Business Reports that most sellers never extract. Sellers who do it monthly catch CVR drops, return rate creep, and margin compression 4-6 weeks before those problems become visible in their bank account.
sellerview.ai connects your real amazon revenue calculator margin per SKU with live Business Report signals - updated daily, automatically. Sessions, CVR, return rate, and real net margin are all in one view without pulling five separate reports from Seller Central.
Business Reports Show Activity. The Amazon Revenue Calculator Shows Profit. Use Both.
Revenue is what customers paid you. Profit is what you kept. Business Reports tell you everything about what customers did. The amazon revenue calculator tells you what you earned from what they did. Both are required to run a real Amazon business.
Check conversion rate, sessions, and Buy Box weekly. Check ordered product sales against amazon revenue calculator net margin monthly. Pull return rate separately and add it to your margin calculation. Reconcile settlement reports against Business Reports quarterly for missed reimbursements.
That is a monthly data practice. It takes 30 minutes. It catches problems before they compound. And it produces decisions based on profit, not revenue.
sellerview.ai shows your real amazon revenue calculator margin per SKU with actual 2026 fees - connected to your live Business Report data without the manual report-pulling. See your real profit numbers
free to start : https://sellerview.ai/
FAQ: Amazon Revenue Calculator and Business Reports
What is the Amazon Business Report and how does it connect to my amazon revenue calculator?
The Amazon Business Report is a Seller Central reporting section that provides per-ASIN traffic, conversion, and revenue data - including sessions, page views, Buy Box percentage, ordered units, and ordered product sales. It shows demand-side activity only. Your amazon revenue calculator provides the economics context - what each unit of demand actually earns after referral fees, FBA fees, COGS, and ad spend. Business Reports without the revenue calculator give you activity. Business Reports with the revenue calculator give you profitability.
What is a good conversion rate in Amazon Business Reports?
Well-optimised FBA listings target 10-15% CVR. Products with 50+ reviews and 4.5+ stars in competitive categories can reach 12-18%. Platform-wide average across all products and categories runs 7-10%. A product below 5% CVR is paying for traffic that is not converting - every session costs you ad spend and organic rank capital without producing a sale. Below 10% CVR on a product live for more than 90 days signals a listing quality problem that your amazon revenue calculator will confirm through margin compression from rising per-unit cost absorption.
How do I calculate actual profit using Amazon Business Reports and the revenue calculator together?
Take Ordered Product Sales from Business Reports for the period. Multiply by your amazon revenue calculator net margin percentage (with full 2026 costs entered: landed COGS, referral fee, FBA fee, placement fee $0.40/unit standard, return rate allocation, storage, TACoS). The result is your estimated net profit for that period. If Ordered Product Sales rose 12% but net margin fell from 11.4% to 8.2%, profit actually declined despite revenue growth. Track this calculation monthly - it takes 5 minutes and shows you whether the business is actually growing.
How do 2026 Amazon fee changes affect what I see in Business Reports vs my revenue calculator?
Amazon Business Reports show Ordered Product Sales - gross revenue before deductions. They do not reflect fee changes. The 2026 fee changes (FBA fees +$0.08/unit average from January, 3.5% fuel surcharge from April, inbound placement fee $0.40/unit standard) appear in your Payments report and your amazon revenue calculator output - not in Business Report revenue figures. This creates a specific mislead: revenue in Business Reports may look the same or growing while real net margin in the revenue calculator is declining because of fee structure changes. Always validate Business Report revenue against revenue calculator margin after any fee update.
What Business Report metrics directly affect my amazon revenue calculator margin output?
Three Business Report metrics directly affect amazon revenue calculator margin: CVR (lower CVR increases per-session cost absorption, reducing effective margin), sessions trend (falling sessions reduces total sales volume while fixed costs remain, squeezing per-unit economics), and Buy Box percentage (below 80% means CVR falls because customers cannot buy from the main button). A fourth metric - return rate - requires a separate Customer Returns report pull but directly affects revenue calculator output through return processing fees. All four should be checked monthly alongside your revenue calculator margin number.
How often should I review my Amazon Business Reports against my revenue calculator?
CVR and sessions: weekly. Buy Box percentage: weekly during active competitive periods. Ordered product sales vs revenue calculator net margin: monthly. Return rate: monthly via Customer Returns report. Settlement reconciliation vs Business Report: quarterly to identify missed reimbursements - sellers who reconcile quarterly recover an average of 1-3% of revenue in missed FBA reimbursements. The 30-minute monthly review (pull all five metrics, run revenue calculator, compare) is the minimum frequency for catching problems before they compound into cash flow issues.