
You're Scaling. One of Your SKUs Is Silently Bankrupting You
You ran the Amazon revenue calculator before launch. The numbers looked good. You went live, ran ads, got orders. Six months later, you're doing more revenue than ever - and somehow the money still isn't there.
Here's the harsh truth. Your Amazon revenue calculator was a pre-launch estimate tool. It used average fees, assumed no returns, and ignored your actual ad spend. It was never built to tell you which of your live SKUs are bleeding money right now.
In 2026, with FBA fulfillment fees up by an average of $0.08 per unit - and low-inventory fees now calculated at the individual FNSKU level - a SKU that looked profitable 12 months ago might be loss-making today. And you'd have no idea unless you look at the right numbers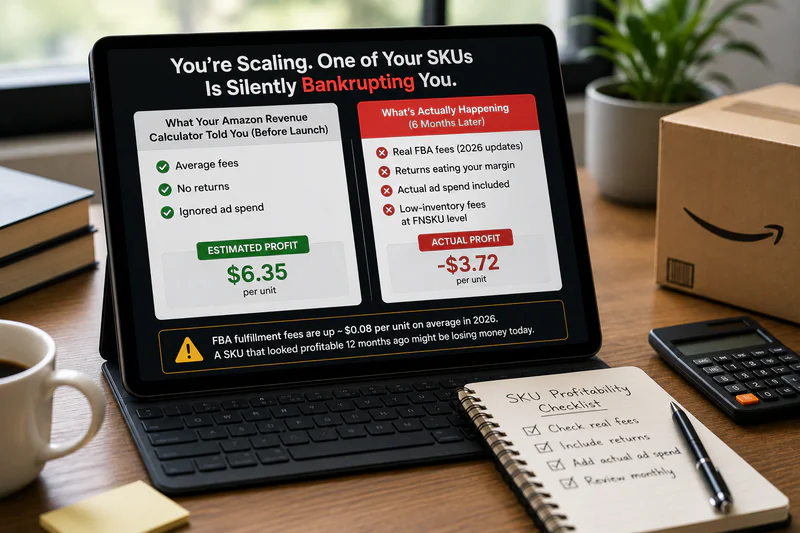
Why Loss-Making SKUs Stay Hidden for So Long
Most sellers have 1–2 SKUs that carry the business. Strong margins. Good velocity. They mask everything else in a blended account view.
Imagine your account shows $95,000 in monthly revenue at a 16% blended margin. That looks like $15,200 in profit. But break it apart and the picture changes completely. Your top 2 SKUs do $65,000 at 26% margin - generating $16,900 in profit. Your remaining 4 SKUs do $30,000 combined at an average of -5.7% margin - draining $1,710 every month. Your actual profit isn't $15,200. It's closer to $15,190 after those losses, and you're wasting inventory spend, storage fees, and ad budget on products that physically cannot make money at their current economics.
The Amazon revenue calculator told you nothing about this. It can't - it doesn't track your live costs, your actual return rates, or your real ad spend allocation per ASIN.
Revenue is not profit. An Amazon revenue calculator measures one. You need to track the other.
The 4 Signals That Identify a Loss-Making SKU Using Your Amazon Revenue Calculator Data
You don't need a complicated system. You need to check 4 things per SKU, every month. Most sellers have all this data available in Seller Central - they just never pull it together per ASIN.
Signal 1: Net Margin Below 10% on a Mature SKU
Any SKU live for more than 90 days with a net margin below 10% - after COGS, referral fees, FBA fees, ad spend, returns, and storage - is in danger zone. Below 5% and you're one fee increase away from negative. In 2026, small standard FBA fulfillment starts at $2.43/unit. Large standard goes up to $6.97+. A single size tier misclassification can wipe 3–5% margin instantly.
Run your real numbers using this formula:
Net Margin % = (Revenue − COGS − Referral Fee − FBA Fee − Ad Spend − Returns − Storage) / Revenue × 100
If the result is under 10% on a mature SKU, you have a problem that scaling will make worse, not better.
Signal 2: TACoS Above 20% After 90 Days
TACoS (Total Ad Spend / Total Revenue) is the honest version of ACoS. If your TACoS is above 20% on a SKU that has been live for 3+ months, the product is not building organic velocity. Every sale still depends on paid ads. That means your margin is permanently subsidising your ad spend - and as soon as you pause, sales collapse.
Healthy TACoS benchmark: under 15% for established products, 15–20% for products 60–90 days old. Above 20% past 90 days means either the listing has a conversion problem, the keyword targeting is wrong, or the product simply cannot compete organically in its category.
Signal 3: Return Rate Above 12% Without a Listing Fix
Fashion and electronics see return rates of 15–25% on specific products. But any category running above 12% returns with no active listing improvement program is a margin leak. A 12% return rate on a $40 product costs roughly $6–8 per returned unit once you factor in the refund plus Amazon's return processing fee. Across 200 units/month, that's $1,200–$1,600 in hidden losses your Amazon revenue calculator never showed you.
Signal 4: Low-Inventory Fee Triggering Per FNSKU
This is new in 2026 and most sellers haven't caught it yet. Amazon now applies the low-inventory-level fee at the individual FNSKU level - not the parent ASIN. If you sell a t-shirt in 6 size/colour variants and one variant drops below 28 days of supply, that variant gets hit with fees on every sale. Some sellers are reporting single SKUs losing up to 10% of their revenue just to low-inventory fees on specific variants. Check your Payments report filtered by ASIN. If you see unexpected fee lines, this is likely the cause.
The Nuance: Not Every Low-Margin SKU Is a Problem
Before you start cutting SKUs, understand what type of low margin you're looking at.
A new SKU under 60 days old with a 5% net margin and TACoS at 25% is normal. You're paying for rank, reviews, and velocity. The question is whether the trajectory is improving month over month. TACoS of 25% → 18% → 12% over 3 months is a healthy launch. TACoS stuck at 24% across 3 months is a product that will never be profitable.
A strategic loss leader - a SKU you sell at break-even to drive bundle purchases or review velocity for a higher-margin ASIN - is a deliberate decision. That's different from an accidental loss-maker you don't know about.
The difference between a strategic loss and an accidental one is visibility. One you choose. The other chooses you.
How to Identify and Fix Loss-Making SKUs in 3 Steps
Step 1: Build Your Per-SKU Profit View
Pull these 4 reports from Seller Central and combine them per ASIN in a spreadsheet:
• Business Reports → Sales & Traffic by ASIN (revenue, units, sessions)
• Campaign Manager → Filter by ASIN (total ad spend per product)
• Payments → Transaction View (FBA fees, referral fees, return processing)
• Returns Report → Return rate per ASIN (units returned / units sold)
This takes 2–3 hours for a 10-SKU catalog. For 40+ SKUs, it takes most of a working day. Sellerview pulls all of this automatically, updated daily, SKU by SKU - no spreadsheet required.
Step 2: Apply the SKU Health Matrix
Step 3: Kill, Fix, or Hold - Set a 45-Day Deadline
For every SKU in the red - set a 45-day deadline with a specific target. Either margin improves to 10%+ through a pricing change, COGS renegotiation, or listing fix, or you reduce inventory to zero and redirect that ad spend to SKUs that earn it.
Most sellers avoid this decision because killing a SKU feels like failure. It isn't. Redirecting $3,000/month in wasted ad spend from a loss-maker to your top-margin SKU can swing total account profit by 30–40% with zero new product development.
Your Amazon Revenue Calculator Gave You a Starting Point. Stop Living There.
The Amazon revenue calculator did its job before launch. It estimated whether a product could work. What you need now is a live view - which products are actually working, which ones are draining you, and what to do about it.
Loss-making SKUs don't announce themselves. They hide inside your blended margin, funded by your best products, until one quarter the numbers don't add up and you can't figure out where it all went.
Run the 4 signals above on every SKU this month. Find the leaks. Fix them or cut them. That's how sellers build a business that actually grows.
FAQ: Amazon Revenue Calculator & Loss-Making SKUs
Can the Amazon revenue calculator tell me which SKUs are losing money?
No. Amazon's free revenue calculator is a pre-launch estimation tool - it calculates projected profit based on inputs you enter, not your actual live costs. It doesn't track real ad spend, actual return rates, or live FBA fees per ASIN. To identify loss-making SKUs, you need to pull actual data from Seller Central reports and calculate real net margin per product.
What is a loss-making SKU on Amazon?
A loss-making SKU is any product where revenue minus all costs - COGS, Amazon referral fees, FBA fulfillment fees, ad spend, returns, and storage - results in a negative number. In 2026, with FBA fees up by $0.08–$0.51 per unit depending on size tier, products that were marginally profitable last year may now be operating at a loss.
How do I find which Amazon SKUs are unprofitable?
Pull four Seller Central reports monthly: Business Reports by ASIN, Campaign Manager filtered by ASIN, Payments Transaction View, and the Returns Report. Combine them in a spreadsheet to calculate net margin per SKU. Any SKU with net margin below 10% on a product live for 90+ days needs immediate review. Tools like Sellerview automate this per-SKU view in real time.
How much do Amazon returns cost per unit in 2026?
A typical return on a $35–$40 product costs $5.50–$8.00 per unit when you factor in the refund amount, Amazon's return processing fee, and repackaging costs. At a 12% return rate across 200 units per month, that's $1,200–$1,600 in monthly losses that your Amazon revenue calculator never captures by default.
What TACoS signals a loss-making SKU on Amazon?
TACoS above 20% on a SKU that has been live for more than 90 days is a strong signal the product is ad-dependent and not building organic sales velocity. At that TACoS level, any drop in ad spend causes sales to collapse - meaning the product's margin is permanently subsidising its own advertising. Healthy TACoS for established SKUs is under 15%.