
Here is your Amazon Profit Calculator
Your Amazon Revenue Is Not Your Income. It's Your Lie.
You check your Amazon dashboard. Revenue is up 22% this month. You feel good. Then you look at your bank balance and something doesn't add up.
That's not bad luck. That's the amazon revenue calculator problem - or more accurately, the absence of one. Amazon shows you sales. You're confusing sales with money. They're two very different things, and the gap between them is where most FBA businesses quietly bleed out.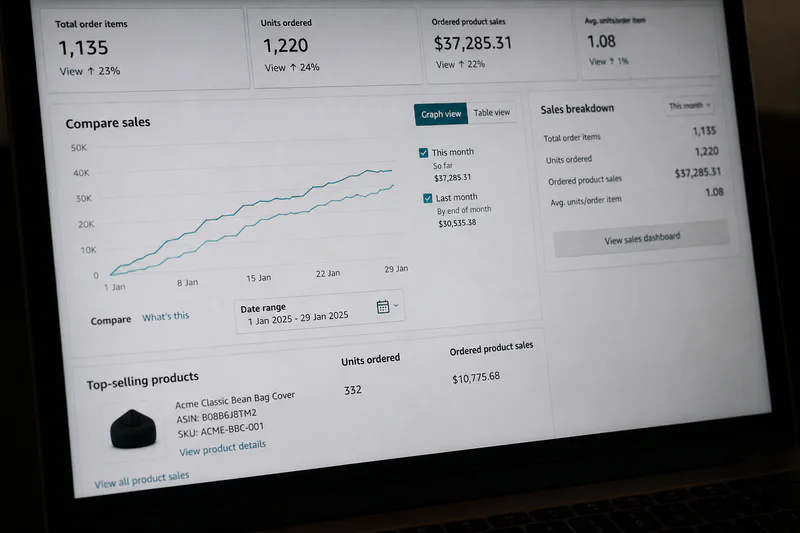
What Amazon's Revenue Number Actually Includes (And What It Hides)
Amazon Seller Central revenue is gross sales: price × units sold + buyer-paid shipping. That's it. A vanity metric dressed as business data.
Here's what it doesn't subtract:
Referral fees: 8-15% of every sale, depending on your category
FBA fulfillment fees: $3.22 to $7.17 per unit for standard-size items (2026 rates)
Storage fees: $0.78/cubic foot monthly - jumping to $2.40/cubic foot from October through December
Returns and refunds: Amazon deducts these automatically, often without a clear line-item notification
Advertising costs: PPC spend never appears in your revenue figure, but it absolutely comes out of your pocket
Cost of goods: Not Amazon's problem. Yours entirely.
Run those numbers on a $50 product. You might be left with $8–$12 in actual margin - if you're lucky. And if your ACoS is above 30%, that margin is already gone.
The Real Cost Stack: What an Amazon Revenue Calculator Actually Reveals
A proper amazon revenue calculator doesn't just show revenue. It builds your full cost stack from sale to bank account. Here's what that looks like for a typical standard-size private label product at $29.99:
That's a 15% net margin on a $30 product. Not terrible - but not the 60%+ gross that Seller Central shows you either. Most sellers see $29.99 and think they're making good money. They're making $4.49. One return wipes out two sales.
Why Most Sellers Never Run These Numbers
The honest answer: it's painful.
When you calculate the real stack, products you thought were winners turn out to be margin traps. That best-selling ASIN generating $40,000/month in revenue? It might net $3,200 - or lose money when ad spend spikes in a competitive week.
Amazon doesn't make this easy to see. The data is fragmented across five different report types: settlement reports, advertising reports, inventory reports, fee reports, and return reports. None of them connect automatically.
So sellers do the easy thing: look at revenue, feel good, reinvest in ads and inventory based on that false signal. They scale a leaking bucket.
How to Use an Amazon Revenue Calculator Without Getting It Wrong
Amazon's built-in Revenue Calculator inside Seller Central is useful but incomplete. It factors in referral fees and FBA fees. It doesn't touch:
Your actual COGS (landed cost including inbound freight and prep)
PPC costs per unit sold
Return rate - which averages 5-8% across most categories and hits 15-20% in apparel and electronics
Monthly storage fees on slow-moving SKUs
Use Amazon's calculator as a floor. Your real number will be lower. Sometimes significantly lower.
A better method: build a per-ASIN P&L using three inputs pulled from actual reports, not the dashboard:
Net proceeds per unit : from your settlement report, not Seller Central revenue
Landed COGS per unit : product cost + inbound shipping + prep fees
PPC cost per unit sold : total ad spend ÷ total units attributed to ads
Those three numbers tell you whether an ASIN is actually profitable. Anything else is guessing.
Stop Managing Revenue. Start Managing Contribution Margin.
Revenue is for press releases. Contribution margin is for business decisions.
Contribution Margin = Net Proceeds - COGS - FBA Fees - PPC Cost per Unit
When you operate by contribution margin, the game changes:
You stop scaling ASINs that are margin-negative at volume
You catch fee hikes before they quietly destroy your P&L
You know the exact ad spend ceiling before an ASIN flips unprofitable
You identify high-return products that cost more in refund processing than they earn
Most Amazon businesses don't need more revenue. They need to stop losing money on the revenue they already have.
The sellers scaling profitably in 2026 figured this out early. The ones still chasing the dashboard number are working twice as hard for half the result.
Your revenue isn't lying to be cruel. It's showing you exactly what you asked for. Start asking for the right number.
FAQ
What does an Amazon revenue calculator actually calculate?
An Amazon revenue calculator estimates your net profit per unit by factoring in referral fees, FBA fulfillment fees, storage fees, and cost of goods. Most basic calculators skip PPC costs and return rates, so real profit is almost always lower than the estimate.
Why is my Amazon revenue high but my profit low?
Amazon's revenue figure is gross sales - it doesn't subtract fees, ad spend, COGS, or refunds. High revenue with low profit usually means your combined fee stack (referral + FBA + PPC) is consuming the bulk of your margin. Per-ASIN P&L analysis shows exactly where the money disappears.
What is a good profit margin for Amazon FBA sellers?
A healthy net margin for FBA is 15-25% after all fees, COGS, and ad spend. Margins below 10% leave almost no buffer for fee increases, return spikes, or rising PPC costs. Many sellers operate at 5-8% without knowing it - until a bad month makes it obvious.
How do Amazon FBA fees affect my actual revenue?
FBA fees typically consume 25-35% of your sale price when you combine referral fees (8-15%) and fulfillment fees ($3.22-$7.17 for standard size). On products priced under $15, fees alone can exceed 50% of revenue, making those ASINs structurally unprofitable.
How do I calculate my real Amazon profit per unit?
Pull your net proceeds per unit from the settlement report (not the dashboard), subtract your landed COGS, then subtract PPC spend per unit sold. The result is your contribution margin. Track this per ASIN every month - fee changes and return spikes show up here before they show up anywhere else.