
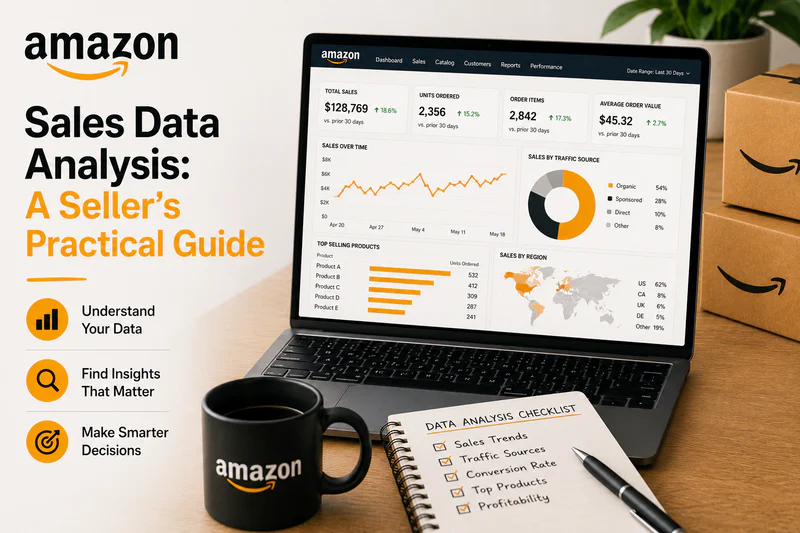
Most Sellers Analyse Revenue. That Is Not the Same Thing
You closed last month at $180,000. Best month ever. You screenshot the Seller Central graph, drop it in the founder group chat, collect the fire emojis. Then your accountant sends the real numbers, and your bank balance grew by $4,200. On $180K in sales.
You did everything right. The ads ran. The units moved. The ranking held. So where did $176,000 go?
That gap — between the revenue you celebrate and the profit you actually keep — is the entire point of Amazon sales data analysis. Done right, it tells you exactly where your money leaks: fees, PPC, returns, storage. Done the way most guides teach it, it just makes you better at admiring revenue you'll never bank.
This is the practical version. No "log in to Seller Central and download a CSV" filler. By the end you'll have a framework to audit your own numbers and find the leaks this week.
Key Takeaways
Revenue is a vanity metric. Sales data analysis only counts if it ends at net profit per SKU — not units sold, not sessions, not gross sales.
Amazon fees eat 30–45% of your selling price before you spend a single dollar on ads. Most sellers never line-item them.
TACoS, not ACoS, tells you whether your advertising is building the business or quietly draining it.
Returns are the most under-counted leak. You lose the product, eat the outbound fee, and pay a returns-processing fee on top.
Run the Profit Leak Stack monthly. Five layers, one number that matters at the bottom.
What Amazon Sales Data Analysis Actually Means

Here's where almost every guide on this topic goes wrong. Search "how to analyze Amazon sales data" and you'll get the same article five times: log into Seller Central, open Business Reports, segment by ASIN, normalize your columns, build a chart. Congratulations — you now have a prettier view of your revenue.
Revenue analysis is not profit analysis. They're not even close.
Real Amazon sales data analysis connects four data streams that live in four different places — your sales report, your advertising report, your fees and settlements, and your own COGS — into one view that answers a single question: which SKUs make money, which ones bleed it, and by how much. That's SKU-level P&L. Everything else is decoration.
The reason most sellers never get there isn't laziness. It's that Amazon scatters the pieces on purpose. Your gross sales sit in one report. Your ad spend sits in another. Your referral and FBA fees are buried in settlement files. Returns show up weeks later. Storage fees hit on the 7th–15th of the next month. Nobody stitches it together, so nobody sees the true picture.
The reports everyone tells you to read (and why they're not enough)
The standard advice points you to three places: Business Reports for sales and traffic, Advertising Reports for PPC, and Brand Analytics for search and competitor data. Useful. Necessary. Nowhere near sufficient.
None of those reports show you contribution margin per unit after everything Amazon takes. Business Reports won't subtract your fees. Advertising Reports won't account for the organic sales your ads triggered. Brand Analytics is great for keyword strategy and tells you nothing about whether a SKU is profitable.
So the data is real, but the conclusion you draw from it — "this product sells well, scale it" — can be flat wrong. Plenty of best-sellers lose money on every unit. They just lose it quietly, one settlement at a time.
The Number Most Sellers Get Wrong
If you take one thing from this guide, take this:
Revenue − Amazon fees − ad spend − returns − COGS − storage = actual profit. Most sellers track the first number and skip the next five.
That's the waterfall. Every line below "revenue" is a place money exits the building. Watch how fast a healthy-looking sale collapses on a $30 product:
Sale price: $30.00
Referral fee (15%): −$4.50
FBA fulfillment: −$5.40
PPC (TACoS allocation): −$4.50
Returns reserve (5%): −$1.50
Storage + inbound: −$0.60
COGS (landed): −$9.00
Net profit:$4.50 — a 15% margin
Here is your Free Amazon Profit Calculator
Now bump returns to 12%, let ACoS creep, and add an aged-inventory surcharge. That same SKU is at breakeven or underwater — while your top-line dashboard still shows it "growing." This is exactly why your P&L can lie to you. The headline number looks great right up until the day it doesn't.
A healthy Amazon brand nets 20–25% after every deduction above. If you don't know your number, you don't have a business — you have a hobby that occasionally deposits money.
The Profit Leak Stack: Where Your Money Actually Goes
After managing ads for 200+ brands, one pattern shows up in every single account that thinks it's profitable but isn't: the money doesn't leak from one big hole. It leaks from five small ones, stacked. Plug them in order and margin reappears.
Leak 1 — Amazon Fees (the silent 30–45%)
Fees are the leak you can't negotiate and most sellers can't even name. Amazon takes its cut across several line items, and for 2026 the structure looks like this:
For 2026, Amazon kept referral fees flat and raised average fees by roughly $0.08 per unit — small on paper, real at volume (Amazon's official 2026 fee update; Seller Central fee changes summary). Always pull the live numbers from Amazon's published FBA fee schedule for your category and size tier — estimates from blogs (including this one) go stale fast.
The fix isn't to fight the fees. It's to know them per SKU so you stop scaling products where fees alone make the unit economics impossible. If your sell price is under ~3× landed cost, the fee stack will likely win.
Leak 2 — PPC Waste (stop optimizing for ACoS)
Here's a take that annoys a lot of agencies: ACoS is a vanity metric dressed up as a performance metric. A 20% ACoS feels great and tells you almost nothing about whether you made money this month.
ACoS only measures ad spend against ad-attributed sales. It ignores the organic sales your ads triggered. That matters because Amazon runs on a flywheel — your ads drive units, units improve your Best Seller Rank, better rank drives organic visibility, and organic sales come "free." As one mentor of mine likes to put it, stopping your ads to save money is like stopping your watch to save time. The cost shows up later, in lost rank.
The honest metric is TACoS — total ad spend divided by total sales (ad + organic):
TACoS = Total Ad Spend ÷ Total Revenue
Falling TACoS while revenue grows means your ads are building organic momentum — that's healthy. Rising TACoS means you're buying sales you used to get for free. Mature brands hold TACoS under ~15%; newer brands run 15–20% while they build rank. The TACoS vs ACoS distinction is the single biggest blind spot in seller advertising, and it's where most "profitable" accounts are actually leaking.
Leak 3 — Returns (the leak you pay for twice)
Returns are brutal because you lose three ways: the product (often unsellable), the original outbound fulfillment fee (gone), and a returns-processing fee on top. A 12% return rate on a thin-margin SKU can erase the entire profit of the units that didn't come back.
Returns also hit ranking. High return rates are a negative signal to Amazon's algorithm — they drag the same BSR your ads worked to build. So a return isn't a one-time cost; it's a compounding one. Fixing it usually lives in the listing: accurate sizing, honest images, and quality that matches the photos.
Leak 4 — Storage & Inventory Drift
Storage looks tiny per unit until you're sitting on 200 days of a slow mover through Q4, when rates spike 2–3×, and an aged-inventory surcharge lands on anything past the long-term threshold. Meanwhile, going out of stock triggers the low-inventory-level fee and tanks the rank you paid ads to build.
The rule of thumb: stock to demand, not to ego. Send a few weeks of cover, replenish often, and watch days-of-supply per SKU like a hawk.
Leak 5 — COGS Drift
Your landed cost is not what it was when you set your price. Freight moved. Your supplier nudged the unit price. The exchange rate shifted. If your COGS in your spreadsheet is six months old, every margin number you've calculated since is fiction. Re-baseline landed COGS every quarter, minimum.
How to Run the Audit This Week:

You don't need a data team. You need ninety focused minutes and the right order of operations.
Pull the four streams. Sales (Business Reports), ads (Advertising Reports), fees (settlement/transaction reports), and your own current landed COGS. Same date range for all four — last 30 days.
Build one row per SKU. Columns: units, gross sales, referral fee, FBA fee, storage + inbound, ad spend, returns, COGS. One screen, every leak visible.
Calculate net profit and margin per SKU. Revenue minus everything. Sort ascending. The losers float to the top — that's your hit list.
Compute TACoS per SKU, not just account-wide. Your account TACoS can look fine while two SKUs quietly burn the budget.
Act on the bottom five. For each money-loser: raise price, cut wasted ad spend, fix the return driver, reduce size tier, or kill it. Pick one lever and move.
That's profit leak detection in its rawest form. It's tedious by hand, which is the honest reason most sellers do it once and never again. The spreadsheet breaks the moment fees change or a new SKU launches.
This is the exact problem Sellerview was built to kill. It stitches your sales, ads, fees, returns, and COGS into live SKU-level P&L automatically — so the audit above runs itself, every day, and flags the leaks before they compound. No CSV gymnastics, no stale spreadsheet. Just the one number that matters, per SKU.
The Bad Advice to Ignore:

A few things you've probably been told that quietly cost you money:
"Just track your ACoS." Covered above. ACoS without TACoS is half a picture, and it's the flattering half.
"Download Business Reports and you're doing analytics." That's reporting, not analysis. Reporting shows what happened. Analysis tells you what to do. Revenue tables do neither for profit.
"Scale your best-sellers." Scale your most profitable SKUs. Your best-seller by revenue and your best-seller by margin are frequently different products. Scaling the wrong one buys you more work and less money.
"Cut ads to protect margin." Sometimes right, often wrong. Cut wasteful ad spend — the search terms and SKUs with no return. Blanket cuts kill the flywheel and your organic rank goes with it.
"Returns are just part of the game." They're a line item you can move. Treat a 2-point drop in return rate like a 2-point margin gain, because that's exactly what it is.
Strong sellers aren't the ones with the prettiest revenue charts. They're the ones who know their net number per SKU and act on it before the quarter closes.
FAQ
What is Amazon sales data analysis? It's the practice of combining your sales, advertising, fee, return, and cost data into one view that reveals true profit per SKU — not just revenue or units. The goal is knowing which products actually make money after Amazon takes its cut.
Where do I find my Amazon sales data? In Seller Central: Business Reports for sales and traffic, Advertising Reports for PPC, and settlement/transaction reports for fees. Brand Analytics adds search data. The catch — none of these alone show net profit, so you must combine them.
Is ACoS or TACoS more important? TACoS. ACoS only measures ad-attributed sales and ignores the organic sales your ads trigger. TACoS (total ad spend ÷ total revenue) shows whether advertising is building your business or draining it. Track both, but decide with TACoS.
How much do Amazon fees take from each sale? Typically 30–45% of the selling price across referral, fulfillment, storage, and conditional fees, before any ad spend. Referral fees run 8–15% for most categories. Always confirm current rates on Amazon's official FBA fee schedule for your size tier.
What's a healthy profit margin on Amazon? Aim for 20–25% net after fees, ads, returns, storage, and COGS. Below 15% leaves no room for fee hikes or a bad return month. If you don't know your margin per SKU, that number is the first thing to fix.
Can I do Amazon sales data analysis in a spreadsheet? Yes, for a one-time audit. The problem is upkeep — fees change, SKUs launch, COGS drifts, and the sheet breaks. A profit analytics tool keeps SKU-level P&L live so the audit runs daily instead of once a quarter.
See Your Real Profit — Not Just Your Revenue
You've got the framework. Now get the number.
Run your products through the Sellerview free profit calculator to see true margin per SKU after fees, PPC, returns, and storage — or start a free trial and let Sellerview.ai find your profit leaks automatically, every day, before they compound.
Stop guessing. Start knowing.