
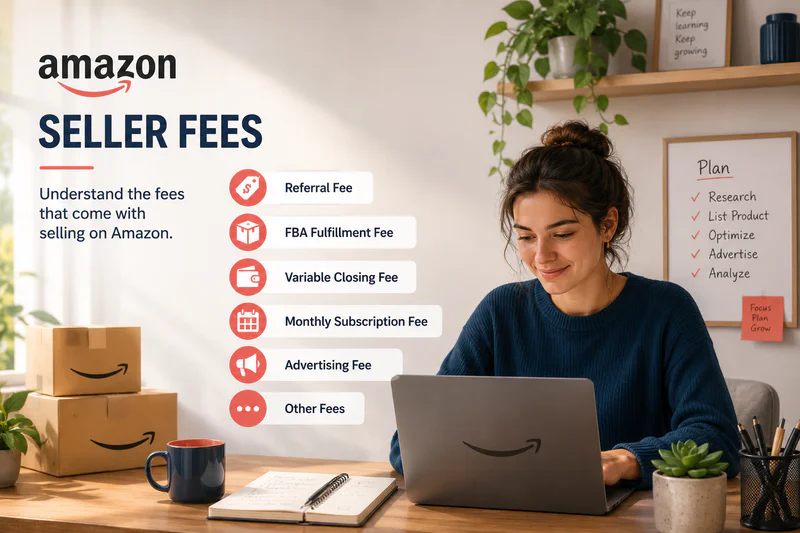
You checked your Seller Central payout in January 2025 and it looked decent. Revenue was up. BSR was holding. Amazon had publicly announced they wouldn't raise fees that year. So you figured you were fine.
You weren't.
Not because Amazon lied. They technically kept their promise - referral fees and base FBA fulfillment fees didn't go up. But seven other things quietly changed in ways that hit your P&L just as hard. And now, heading into mid-2026, a new wave of fee adjustments has already kicked in - including a fuel surcharge that didn't make any headlines.
This article breaks down exactly what changed between 2025 and 2026, what it actually costs you as a US FBA seller, and - more importantly - how to calculate whether your margins are still viable after all of it stacks up.
What Amazon Actually Promised for 2025 - And What It Really Meant
In late 2024, Amazon made a seller-friendly announcement: no increases to US referral fees or FBA fulfillment fees in 2025. No new fee types either. This was legitimately good news - especially after 2024 introduced the inbound placement service fee that blindsided thousands of US sellers mid-Q1.
But here's the thing. A "fee freeze" on two line items doesn't mean your cost structure stayed flat. Amazon's fee ecosystem has more than a dozen components. Freezing two of them while adjusting the rest is still a net change. And most sellers never noticed.
Here's what actually shifted in 2025 that didn't make the headlines:
Inbound placement service fees for large items dropped ~$0.58/unit — a genuine win, but only for oversized sellers who were tracking it
Low-price FBA fee tier expanded - products under $10 get an ~$0.86 discount on fulfillment fees
Aged inventory surcharge: new 456+ day tier added - hitting sellers carrying slow-moving stock at $6.90/unit
Low inventory level fee fully enforced - run under 28 days of supply consistently and you're paying a per-unit surcharge on every unit sold
Holiday peak fees (Oct 15 – Jan 14) held at 2024 rates - $0.19–$0.63/unit — no increase, but still material at volume
Inbound defect fees tightened - non-compliant shipments now trigger faster and at higher rates
Return processing fees restructured for apparel and high-return rate categories
None of these made headlines. Stack them on a $22 product doing 500 units a month and the number looks completely different by Q4.
The Effective Fee Rate: The Number Amazon Never Shows You
Every blog you'll find on Amazon seller fees shows you a table. Referral fee: 15%. FBA fulfillment: $3.22. Storage: $0.78/cubic foot. Each line item in isolation - each looking manageable on its own.
Nobody shows you what they add up to as a percentage of your selling price. That number is the one that actually matters for pricing decisions.
Here's what the math looks like for a typical US FBA seller in 2025, across different price points:
At a $15 selling price, Amazon is effectively taking 42 cents of every dollar before you account for COGS, advertising, or any overhead. That's not the referral fee. That's the combined effective fee load - and it's the number that determines whether a product is viable at all.
This is why understanding the full stack of what Amazon takes from your margin matters more than any single fee line. The individual numbers are fine. It's the compound effect that quietly erodes your P&L.
Simple funda: if your selling price is under $20, you need to audit this math on every ASIN. The fee load at that price point makes thin-margin products structurally unviable - not occasionally, structurally.
Fees + PPC = Your Real Margin. And Almost Nobody Does This Math.
Here's what every Amazon fee article skips entirely.
In most competitive US categories, you cannot maintain meaningful visibility without advertising spend. A 10–20% TACoS is the baseline for established products. For new launches, 25–35% is normal in the first 90 days. But advertising cost doesn't sit in a separate bucket - it comes out of the same revenue that your fees are already eating into.
Here's the actual math on a $25 product:
Selling price: $25.00
Amazon fees (effective rate ~35%): −$8.75
TACoS at 18%: −$4.50
COGS (landed cost, typical for standard goods): −$6.00
Net margin: $5.75 (23%) - viable
Now watch what happens when TACoS climbs to 25% - normal for a competitive sub-category at mid-rank:
Net margin: $25.00 − $8.75 − $6.25 − $6.00 = $4.00 (16%)
At 30% TACoS with an 8% return rate, net margin turns negative before you've counted a single dollar of overhead, software, or team cost.
This is why TACoS is the metric that ties your advertising spend directly to total revenue - and when it interacts with a 35–42% fee load, the math becomes unforgiving fast.
Use this formula to find your break-even advertising ceiling:
Break-Even TACoS = 1 − COGS% − Effective Fee Rate%
On a $25 product with 24% COGS and 35% fees: your break-even TACoS is 41%. Anything above that is burning cash. Most sellers in competitive categories run 20–30% TACoS - which means the margin cushion is thinner than revenue alone would suggest.
FBA vs FBM vs SFP vs MCF: The Comparison Nobody Bothers to Make

Most articles tell you FBA is convenient but expensive, and FBM is cheaper but more work. That's not wrong - it's just incomplete. There are four fulfillment models available to US sellers, each with a materially different cost structure.
1. FBA (Fulfillment by Amazon)
The default. Amazon stores, picks, packs, and ships. You pay fulfillment fees + storage + all surcharges. Prime-eligible by default. Best for products with consistent velocity and predictable demand. The full line-item breakdown of what FBA actually costs is more complex than most sellers realize when they start out.
2. FBM (Fulfilled by Merchant)
You handle storage and fulfillment. No FBA fees, no storage surcharges - but you lose the Prime badge unless you qualify for SFP (see below). Referral fee still applies regardless of how you fulfill. Works best for oversized, heavy, or slow-moving inventory where FBA storage costs outweigh the fulfillment savings.
3. Seller Fulfilled Prime (SFP)
You fulfill from your own warehouse but carry the Prime badge. Amazon re-opened SFP in 2023 after years of restriction. Requirements are strict: same-day ship for most Prime orders, sub-96-hour delivery, cancellation rate under 0.5%, and 99%+ of orders through Amazon Buy Shipping. If you can consistently hit those metrics, SFP gives you Prime visibility without FBA storage exposure. Storage savings on heavy or slow-moving SKUs can run $0.80–$2.50/unit — material at volume.
4. MCF (Multi-Channel Fulfillment)
This is the one almost no article covers - and it's increasingly relevant for sellers running DTC channels alongside their Amazon store. MCF lets you use Amazon's fulfillment network to ship orders placed on your own website, Shopify store, or any other channel. Amazon picks and ships using the same infrastructure, but at MCF-specific rates that run roughly 20–40% higher than standard FBA fulfillment fees per unit. No Prime badge on MCF orders. But if you're managing one inventory pool across channels, the operational simplification often justifies the premium.
The decision is never "FBA or FBM." It's which model fits each SKU's specific margin structure. Many established US sellers run FBA for core high-velocity SKUs, FBM for slow movers, and MCF for DTC overflow. That's not complexity - that's margin management.
Fee Impact by Product Lifecycle Stage: The Map Nobody Draws
The same fee structure hits you differently depending on where your product is in its lifecycle. If you don't plan for this, you get squeezed at every stage in a different way.
New Launch (Months 0–3)
This is the most expensive phase on a per-unit basis. You're running high PPC spend (25–40% TACoS) to build velocity. But if you haven't sent in enough inventory to maintain 28+ days of supply, Amazon is simultaneously hitting you with the low inventory level fee. You're paying more per unit in fees at the exact moment your revenue is at its lowest. This is a structural double-squeeze - there's no hack for it, only a plan. Send in enough inventory to stay above the 28-day threshold from day one, even if it means higher upfront working capital.
Growth Phase (Months 3–12)
Velocity is building, PPC spend is normalizing, and you're getting real data on demand patterns. This is when the inbound placement service fee becomes negotiable - if you opt into Amazon-Optimized Shipment Splits, Amazon waives or significantly reduces the placement fee by routing inventory across fulfillment centers automatically. The tradeoff is reduced control over where stock lands geographically. At growth-phase volumes, the waiver is usually worth taking.
Mature ASIN (12+ Months)
Velocity is stable, TACoS has normalized, and you've likely found your BSR floor. The risk at this stage isn't per-unit fees - it's aged inventory accumulation. Seasonal products or SKUs with demand fluctuations will start hitting the 181-day surcharge if you over-indexed inventory in a slower period. Run an ASIN-level storage review every 90 days without exception. The cost of carrying dead stock compounds faster than most P&Ls can absorb quietly.
Declining Product
This is where fee awareness becomes genuinely critical. A declining ASIN with falling velocity generates fewer sales to absorb fixed fee costs, while storage fees keep accumulating daily. Below roughly 10 units/month for a standard-size product, your monthly storage cost per unit often exceeds $1.00. Add the aged inventory surcharge when it crosses 181 days, and you're paying Amazon to store a product that isn't moving. For apparel or high-return categories, Amazon return fees add another compounding layer to the P&L bleed on declining ASINs.
The decision framework is simple: when monthly storage cost + aged inventory surcharge exceeds expected monthly gross margin from the ASIN - liquidate or remove. Don't let the 456-day surcharge tier make the decision for you at $6.90/unit.
What's New for 2026: The Fee Landscape Right Now
Amazon made several structural changes effective in early 2026 that haven't been widely covered but are already showing up in US seller transaction reports.
New FBA Fulfillment Fee Tiers (February 2026)
Amazon restructured fulfillment fee bands based on selling price, not just size and weight. Products priced $10–$19.99 now have a dedicated mid-tier rate that - in certain standard-size bands - is $0.50–$0.77 lower than the prior structure. Genuine savings for mid-range products. If you haven't rechecked your FBA fee estimates since January, your ASIN-level margin estimates may be understating profitability.
Fuel & Logistics Surcharge (April 2026)
A 3.5% fuel and logistics surcharge was introduced on FBA fulfillment fees - embedded in the per-unit fee, not broken out as a separate line. On a $4.50 fulfillment fee, that's $0.16/unit. At 5,000 units a month: $800 in new cost that wasn't in your 2025 model. Small. Compounds.
Inbound Placement Waiver - Updated Compliance Requirements
The waiver for Amazon-Optimized Shipment Splits now requires a minimum shipment compliance rate to stay active. Sellers who had been passively benefiting from the waiver are seeing the fee reappear in transaction reports without any notification. Check your Shipping Queue compliance metrics before your next send-in. For exact size-tier rates across all 2026 fee changes, the complete Amazon seller fees 2026 breakdown has the full numbers.
2025 vs 2026: The Side-by-Side Every US Seller Needs
The headline: Amazon held the line on referral and base FBA fees across both years. But between the 2026 fuel surcharge, the aged inventory tier enforcement, and the tightened inbound placement waiver conditions, the effective cost structure in 2026 is 2–4% higher than 2025 for most US FBA sellers who aren't actively managing inventory health.
Your Q2 2026 Fee Audit: Where to Start
If you haven't run a structured fee audit since January, here's the exact sequence:
Pull your Transaction Report and search for "FBA Inbound Placement Service Fee" line items. If you're seeing charges you weren't expecting, your Amazon-Optimized Shipment Split waiver may have lapsed.
Check inventory age in Seller Central (Inventory → Inventory Age). Flag every ASIN approaching 150 days. Build a removal or liquidation plan before they cross 181 days and the surcharge kicks in.
Calculate effective fee rate by ASIN for every product under $20. If the combined fee load is above 40%, that ASIN needs a pricing review or a fulfillment model change.
Run break-even TACoS for your top 10 ASINs: 1 − COGS% − Effective Fee Rate%. If your actual TACoS is within 5% of break-even, you're running at risk margin - not profit margin.
Audit your fulfillment model per SKU. Are there slow-moving products that should shift to FBM before the Q4 storage spike hits at $2.40/cu ft?
Review inbound defect flags in Seller Central. Even one compliance failure per 20 shipments compounds into meaningful fee exposure over a quarter.
Fee awareness without real-time visibility is just a monthly guessing game. Knowing what healthy Amazon FBA profit margins look like after fees and ads gives you the benchmark - the audit tells you whether your portfolio is above or below it.
That's exactly what Sellerview is built for. Not another dashboard. Actual answers: your effective fee rate by ASIN, where storage cost is compounding, which products are above break-even TACoS, and where margin is leaking before it shows up in your bank account.
The Bottom Line
Amazon's 2025 fee freeze was real. It was also incomplete.
The sellers who came out ahead in 2025 weren't the ones who took the freeze announcement at face value - they were the ones who tracked the seven things that shifted anyway and adjusted their cost models accordingly. In 2026, the fee environment is marginally more expensive than 2025, but the bigger risk isn't any single line item.
It's the gap between what Seller Central shows you and what your P&L actually reflects.
Know your effective fee rate. Know your break-even TACoS. Know which lifecycle stage each ASIN is in and what that means for your storage exposure heading into Q4.
The sellers running clean margins in 2026 aren't the ones with the best products. They're the ones doing this math - consistently, by ASIN, every quarter.