
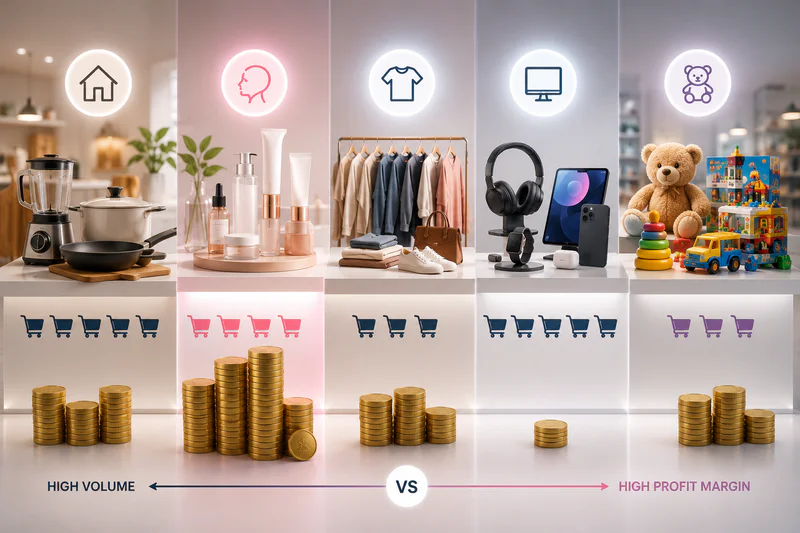
The 5 best-selling categories on Amazon US by volume are Home & Kitchen, Beauty & Personal Care, Clothing/Shoes/Jewelry, Electronics, and Toys & Games. But volume and profit are two different things. Beauty & Personal Care leads on actual net profit margins (25–35%), while Electronics often delivers the worst margins (8–15%) despite high sales velocity. The best-selling category is not automatically the most profitable one to sell in - and that gap is where most new sellers lose money.
What you'll learn in this post:
The 5 highest-volume Amazon categories with verified 2026 margin benchmarks for each
Why the categories with the most buyers often deliver the least seller profit
The margin threshold to hit in any category before committing sourcing capital
Everyone looks at Amazon's Best Sellers list and sees opportunity. The categories at the top - millions of buyers, thousands of daily orders - feel like the obvious place to build a business. So sellers pour capital into them. Then reality hits.
Volume is not margin. A category doing $10 billion in annual GMV can still be a margin graveyard for the average FBA seller. After analyzing profitability data across 300+ Amazon brands in Home & Kitchen, Beauty, Electronics, and Sports, the pattern is consistent: sellers enter top categories chasing demand, then spend the next 6 months watching fees, ad costs, and competition eat what was supposed to be profit.
Here's what the 5 best-selling Amazon categories in the US actually look like on a P&L - not a sales dashboard.
What Is an Amazon Best-Selling Category?
An Amazon best-selling category is a top-level product grouping that consistently generates the highest order volume on Amazon.com, based on Amazon's Best Sellers Rank (BSR) data across millions of active listings.
BSR measures sales velocity within a category - it does not measure seller profitability, competition density, or net margin after fees.
Here is your Free Amazon Profit Calculator
The 5 Best-Selling Amazon US Categories in 2026 - With Real Margin Data
1. What are the real profit margins in Amazon's Home & Kitchen category?
Home & Kitchen is Amazon's highest-volume category by number of listings and one of the most consistent performers by sales. It accounts for a significant share of Amazon's third-party seller revenue year-round - demand doesn't collapse between peak seasons the way it does in Toys or Holiday categories.
The margin story is mixed. Selective niches in Home & Kitchen - storage and organization, kitchen gadgets, home decor - hit 18–25% net margins. But the category is enormous, which means competition is intense in most subcategories. Products priced under $20 in this category often struggle to generate meaningful profit after FBA fulfillment fees, referral fees (typically 15%), and ad spend.
The sellers who win in Home & Kitchen are not selling generic products at average prices. They're selling differentiated products in third-tier subcategories where BSR data shows demand but review barriers are still manageable.
2026 margin benchmark: 18–25% net (selective niches); 8–15% for undifferentiated products
2. How profitable is Amazon's Beauty & Personal Care category for FBA sellers?
Beauty & Personal Care is the most profitable of the 5 best-selling categories for FBA sellers in 2026. Net margins of 25–35% are achievable and, in some niches like skincare tools and men's grooming, exceed 35%.
Three structural reasons explain why Beauty outperforms on margin. First, products are typically small and lightweight - FBA fulfillment fees are lower than for comparable-revenue categories. Second, return rates are among the lowest on Amazon (under 5% for most beauty subcategories). Third, repeat purchase behavior is strong - a buyer who repurchases every 45 days lowers your effective customer acquisition cost with every reorder.
K-beauty, men's grooming, and skincare tools are the three most active sub-niches with accessible review barriers in 2026. All three have lower average review counts than mature Beauty subcategories, meaning new products can compete without needing 2,000+ reviews to rank.
The one real risk in Beauty: Amazon's compliance requirements are stricter than most categories. Products with cosmetic or topical claims require documentation. Getting this wrong means listing suppression, not just a return.
2026 margin benchmark: 25–35% net | Return rate: 3–7% | Repeat purchase rate: high
3. What profit margins do Electronics sellers actually make on Amazon in 2026?
Electronics is Amazon's most searched category by volume and one of the lowest-margin categories for independent FBA sellers. Branded electronics - Apple, Sony, Samsung - are not realistic for private label or most wholesale sellers. The actual opportunity is in Electronics accessories: cables, cases, charging gear, audio accessories.
Electronics accessories hit 25–35% margins according to 2026 data from Seller Snap - driven by low fulfillment costs relative to selling price, and strong year-round demand. But the category has a significant return problem. Electronics overall has a 15–20% return rate, compared to 3–7% for Beauty. Each return in an Electronics product costs you the refund, plus FBA return processing fees, plus the risk of the returned unit being unsellable.
Sellers entering Electronics need to price in a realistic return rate from day one. Ignoring it in the unit economics calculation is one of the most common margin calculation errors in this category.
2026 margin benchmark: Electronics accessories 25–35% | Branded electronics: not viable for most sellers | Return rate: 15–20%
4. Is Clothing, Shoes & Jewelry a good category to sell in on Amazon?
Clothing, Shoes & Jewelry is a top-3 category by sales volume and one of the hardest for FBA sellers to make consistently profitable. The return rate in apparel is 20–30% - the highest of any category on this list. Every 1-in-4 to 1-in-3 units sold comes back.
At a 25% return rate, a product with 40% gross margin before returns ends up at approximately 10–15% net margin once returns, reprocessing fees, and unsellable inventory are factored in. That's before advertising.
Clothing works for sellers with strong brand differentiation, precise size guides that reduce fit-related returns, and listings with enough visual content (video, multiple angles, fit models) to set buyer expectations correctly. For sellers entering without those assets, the return economics are brutal.
2026 margin benchmark: 10–20% net (after returns) | Return rate: 20–30% | High ad dependency for new listings
5. What are the profit margins in Amazon's Toys & Games category?
Toys & Games is a strong volume category year-round with significant Q4 upside - the category sees 3–4x normal sales velocity from October through December. Net margins of 18–28% are achievable for differentiated products in underserved niches.
The margin risk in Toys is twofold. First, Q4 dependency: sellers who over-index on holiday demand and then carry unsold inventory into Q1 face long-term storage fees that can wipe out their seasonal profit. Amazon's long-term storage fee kicks in for inventory held over 365 days and compounds quickly for slow-moving SKUs. Second, the category has a high proportion of licensed products (IP-heavy) that independent sellers can't replicate without licensing agreements.
The opportunity in Toys in 2026 sits in educational toys, STEM kits, and outdoor activity products - three sub-niches with growing demand, lower IP complexity, and manageable review barriers.
2026 margin benchmark: 18–28% net | Strong Q4 seasonality | Long-term storage risk if Q4 inventory doesn't clear
Which Category Should You Actually Sell In?
Here's how all 5 stack up on the metrics that matter:
The category to start with based on margin potential, return rates, and repeat purchase behavior: Beauty & Personal Care - consistently. Not because it's easiest, but because the structural economics favor the seller more than any other top-5 category.
The category to approach with the most caution: Clothing - not because sellers don't make money in it, but because the return rate can detonate your margin before you understand what's happening.
The Number That Should Govern Every Category Decision
Target a minimum 20% gross margin before advertising in any category you enter. If your product can't hit 20% gross margin after COGS, referral fees, and FBA fees - before a single dollar of ad spend - the math doesn't work at realistic TACoS levels for new products.
That threshold applies regardless of how much volume a category does. Demand is necessary. Margin is what turns demand into a business.
Sellerview.ai tracks your actual net margin by SKU across all categories - so you don't discover a margin problem 3 months after you've already scaled inventory. See your real numbers on Sellerview.ai. Free to start.
Frequently Asked Questions
What is Amazon Best Sellers Rank and does it tell me if a category is profitable?
Amazon Best Sellers Rank (BSR) measures a product's sales velocity relative to other products in its category - it updates hourly and reflects recent sales, not historical performance. BSR does not tell you anything about profit margin, competition density, or whether a category is worth entering. A product with BSR #50 in its category could be running at a loss if its cost structure is wrong.
Which Amazon category has the highest profit margins for FBA sellers in 2026?
Beauty & Personal Care leads on net profit margins for FBA sellers in 2026, with benchmarks of 25–35% net after all fees. The category benefits from small, lightweight products (lower FBA fulfillment fees), low return rates (3–7%), and strong repeat purchase behavior. Electronics accessories also hit 25–35% in well-chosen niches but carry a much higher return rate risk.
What profit margin should I target before entering a best-selling Amazon category?
Target a minimum 20% gross margin before advertising - meaning after your COGS, Amazon referral fees, and FBA fulfillment fees, but before ad spend. If you can't hit 20% gross at that stage, a realistic TACoS of 15–20% on a new product launch will take you negative. Most sustainable Amazon businesses run 15–25% net margin after all costs including ads.
Why is Clothing such a hard category to make profitable on Amazon despite high sales volume?
Clothing, Shoes & Jewelry has a return rate of 20–30% - the highest of any major Amazon category. At a 25% return rate, your effective cost per sale increases dramatically because you pay FBA fees on the original sale, absorb the return processing fee, and may receive inventory back in an unsellable condition. Even a 40% gross margin before returns can shrink to 10–15% net once realistic return economics are factored in.
How did Amazon's 2026 fee changes affect profit margins across best-selling categories?
Amazon raised FBA fulfillment fees by an average of $0.08 per unit effective January 15, 2026 - the first fee increase after holding rates flat through 2025. For lightweight categories like Beauty and Electronics accessories, the impact is minimal. For heavier Home & Kitchen products already operating on thin margins, $0.08 per unit at 500 units/month is $40/month in additional cost per SKU. A 3.5% fuel surcharge also took effect April 17, 2026, adding to inbound shipping costs across all categories.
How do I know if my product is actually profitable in a top Amazon category?
Run a complete unit economics check before sourcing: selling price minus referral fee, FBA fulfillment fee, COGS (including freight), and a realistic ad spend estimate (use 15% TACoS as a minimum baseline for new products). If the result is positive and above 15% net, the product has a viable margin structure. If it's below 10% or negative at that calculation, the category or price point needs to change before you commit capital. Sellerview.ai automates this calculation at the SKU level so you can track margin in real time as costs shift.