
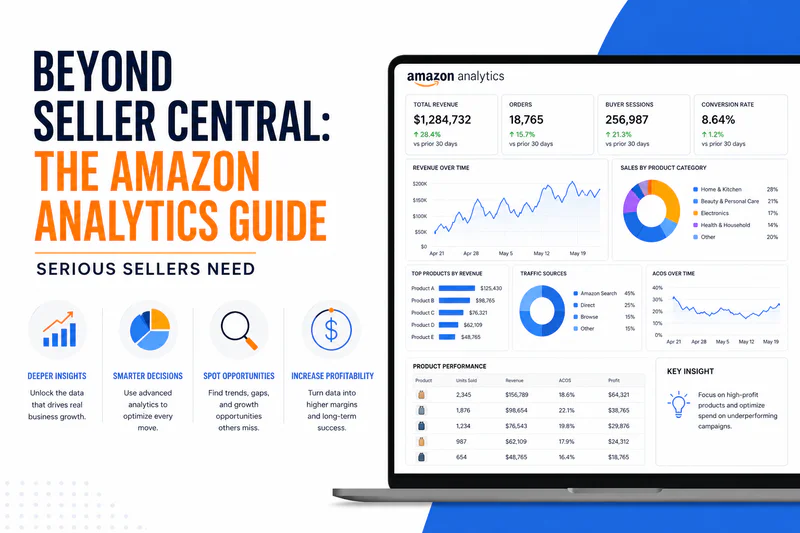
If you're running your Amazon business on Seller Central reports alone, you're piloting a plane with half your instruments broken.
Seller Central gives you revenue. It gives you orders. It gives you a Settlement report dense enough to make an accountant sweat. What it doesn't give you — what it fundamentally cannot give you — is a clear answer to the one question every seller actually needs to ask: "Am I actually making money?"
This guide breaks down exactly what Seller Central's reports miss, which metrics actually move your business, and how serious Amazon sellers are using advanced profit analytics to outpace competitors who are still flying blind.
What Seller Central Actually Gives You (And What It Doesn't)

Amazon Seller Central has over 50 report types across Business Reports, Advertising Reports, Inventory Reports, and Settlement data. That sounds comprehensive. It isn't.
Here's a clear-eyed breakdown of what you're actually working with:
What Seller Central does well:
Gross revenue and units sold (Business Reports)
Session and page view data (Traffic Reports)
FBA inventory levels and stranded inventory flags
Raw settlement data — every transaction Amazon processed
Campaign-level advertising spend and ACoS (Advertising Reports)
Brand Analytics: Search Query Performance, Top Search Terms, Market Basket Analysis (Brand Registry only)
What Seller Central structurally cannot do:
Calculate true profit per SKU or per ASIN
Incorporate your Cost of Goods Sold (COGS)
Show you TACoS (Total Advertising Cost of Sale) without manual cross-referencing
Alert you proactively when margins erode or a campaign overspends
Give you a unified P&L across multiple marketplaces
The uncomfortable reality: Seller Central shows revenue and some fees, but it doesn't calculate true profit because it's missing COGS, PPC costs per product, inbound shipping, and promotional discounts. Most reports update every 24–72 hours — which means by the time you spot a problem in your data, you've already lost the money.
The 7 Critical Data Gaps in Seller Central Reports

Understanding these gaps is the foundation of building smarter analytics. These aren't minor inconveniences — each one represents real money leaking out of your business undetected.
1. No COGS Integration
Seller Central has no field, no report, and no interface for entering or tracking your Cost of Goods Sold. Revenue exists in Business Reports. Fees exist in Settlements. COGS exists nowhere. Building an accurate P&L requires you to combine multiple data sources manually — and sellers routinely undercount COGS by 15–20% by stopping at factory price and ignoring freight, customs, prep, and packaging.
2. Siloed Advertising Data
Your Advertising Console shows ACoS at the campaign level. Your Business Reports show revenue at the ASIN level. These two datasets live in completely separate dashboards with no native link between them. You cannot, inside Seller Central, see: "This specific ASIN generated $1,680 in revenue this month — but once I net out $456 in ad spend attributed to it, what's my actual margin?" That calculation simply doesn't exist natively.
3. The TACoS Black Hole
Seller Central displays ACoS (Advertising Cost of Sale based on ad-attributed revenue only). It does not show TACoS (Total Advertising Cost of Sale based on all your revenue). These two numbers can differ by 10–20 percentage points for established products with strong organic rank. Making PPC decisions based on ACoS alone, when TACoS is the actual profitability indicator, is a structural mistake that compounds over time.
4. 24–72 Hour Data Lag
Most Seller Central reports lag by 24–72 hours. The Sales Dashboard shows preliminary figures within hours, but final numbers settle in 1–3 days. If a product has a sudden return spike on Monday, you might not see it clearly until Wednesday. If a PPC campaign starts overspending Tuesday morning, it burns money until you check Friday's report. For sellers doing $48,000+ per month, that lag is commercially expensive.
5. No Predictive or Forward-Looking Analytics
Seller Central is entirely backward-looking. There is no forecasting, no demand planning, no inventory reorder prediction. You are always reacting. You never anticipate. Sellers managing large catalogs — 50, 100, 500 SKUs — need forward-looking signals to avoid stockouts and excess storage simultaneously. Seller Central offers nothing in this direction.
6. No Automated Alerts
There are no proactive notifications in Seller Central for sudden sales drops, PPC budget spikes, inventory depletion warnings at a meaningful threshold, or return rate anomalies. You must check reports manually. In a business with hundreds of variables changing daily, that's operationally untenable.
7. Fragmented Multi-Marketplace Data
If you sell on Amazon.in, Amazon.com, Amazon.co.uk, Amazon.de, and Amazon.co.jp — you have five completely separate Seller Central accounts, five sets of reports, five currencies, and zero native consolidation. Each marketplace is isolated. Understanding your true global business performance requires manual export, manual currency conversion, and manual aggregation. Nothing about this scales.
Want to know your real profit? Give a try toAmazon Profit Calculator
The Metrics That Actually Matter: Beyond Revenue

Amazon seller analytics covers five distinct categories. Each answers different questions. Seller Central covers roughly the first one and a half.
1. Sales Analytics
The basics: daily revenue per SKU, units sold per marketplace, average order value, week-over-week growth rates. The catch: Seller Central does this adequately for historical analysis, but the 24–72 hour delay means you're always looking at yesterday's reality. Real sales analytics requires near-hourly updates.
Key metric: Revenue is a vanity number without margin context. Track it as a baseline, not an outcome.
2. True Profitability Analytics
This is where Seller Central fails completely. Profitability analytics calculates your actual margin after every cost: COGS, FBA fulfillment fees, referral fees, storage fees, returns processing, PPC spend, and promotional discounts. A product doing $600 per month in revenue might be losing money once you account for all 40+ fee types Amazon charges.
Key metrics to track:
CM1 (Contribution Margin 1): Revenue minus COGS
CM2 (Contribution Margin 2): CM1 minus marketing and ad spend
CM3 (Contribution Margin 3): CM2 minus all Amazon fees, storage, and returns
Benchmark: Healthy true margins (after all fees including advertising and returns) typically range from 15–25% for successful FBA sellers. Anything below 10% is high-risk — one fee increase or a return spike can push you negative. Critically, 40%+ of SKUs in a typical catalog are unprofitable. Winners subsidize losers. Most sellers don't know which is which.
3. Advertising Analytics (Beyond ACoS)
ACoS tells you how efficiently your ad spend generated ad-attributed revenue. It tells you nothing about whether those sales were actually profitable. A product with 18% ACoS that has 22% FBA fees, 12% COGS, and 6% storage costs isn't profitable — it's hemorrhaging margin while looking healthy on the Advertising Console.
True advertising analytics requires ACoS connected to real margins: every Amazon fee deducted before calculating break-even ACoS per SKU, with COGS baked in. Most sellers discover their real break-even ACoS is 10–20% lower than they assumed.
Key metrics: TACoS, break-even ACoS per SKU, profit-weighted ROAS, ad spend as % of total revenue.
4. Product Performance Analytics
Beyond top-line revenue, every product needs ongoing ASIN-level tracking: return rate trends, conversion rate by traffic source, Buy Box percentage, review velocity, and ranking movement against target keywords. These variables shift constantly and directly impact profitability.
A frequently missed insight: Your top sellers by revenue are often not your top sellers by profit. High PPC spend or high return rates can make bestsellers unprofitable.
5. Inventory and Operational Analytics
Aged inventory accumulates storage fees that compound quietly. Long-term storage fees for inventory 181+ days old can exceed the product's value. FBA placement fees introduced in 2024, and updated in 2026, add inbound costs that many sellers don't model accurately. Inventory analytics predicts reorder points before stockouts happen and flags aged units before they become storage-fee liabilities.
True Profit Calculation: The Formula Seller Central Can't Do
Here's the actual formula for per-unit true profit. This is the calculation Seller Central does not — and structurally cannot — perform without you manually combining data from at least four separate reports.
True Profit per Unit =

  Selling Price
- Referral Fee (6–15% depending on category)
- FBA Fulfillment Fee ($3.06–$6.10 for standard size US; updated January 15, 2026)
- FBA Storage Fee (monthly rate × volume × days; 3× rate October–December)
- Inbound Placement Fee (introduced 2024; varies by shipment type)
- Low-Inventory-Level Fee (triggered below threshold)
- Return Processing Fee (if applicable)
- Refund Administration Fee (if applicable)
- Aged Inventory Surcharge (181+ days)
- COGS (product + freight + customs + prep + packaging)
- Ad Spend Attribution (your TACoS% × selling price)
= TRUE PROFIT PER UNIT
The average FBA profit margin for Amazon sellers sits between 15% and 20% according to TrueProfit's 2025 benchmark data. Sellers who do not track every fee, every return, and every ad dollar risk slipping below that range without realizing it.
The COGS undercount problem: Most sellers stop COGS at the factory gate. Real COGS = manufacturing + packaging + quality inspection + freight to Amazon warehouse + import duties. Undercount by even 15% on high-volume products and your profitability model is broken at the foundation.
The returns problem: Returns cost more than the refund. You paid for the click (ad cost), Amazon charged the referral fee, the customer returned the item, and 30–50% of returned items are unsellable. That sale went from profitable to a net loss, but ACoS still counts it as a conversion.
ACoS vs TACoS: Why One Metric Is Lying to You

This is one of the most important conceptual shifts in Amazon
seller analytics.
ACoS (Advertising Cost of Sale) = Ad Spend ÷ Ad-Attributed Revenue
TACoS (Total Advertising Cost of Sale) = Ad Spend ÷ Total Revenue (organic + paid)
For a new product launch with no organic sales, ACoS ≈ TACoS. They're essentially the same number.
For an established product with strong organic rank — where most sales are organic and ads are just maintaining visibility — the gap between ACoS and TACoS can be massive. A product with 28% ACoS might have a 9% TACoS if most of its revenue is organic. That's a fundamentally different business situation, and ACoS alone tells you nothing about it.
Why this matters practically:
If you spend $24 on ads and generate $120 in total sales, your TACoS is 20%. That 20% comes directly off your margin. If you're only optimizing for ACoS and ignoring total revenue impact, you're optimizing the wrong number.
Amazon's Advertising Console does not show TACoS. Seller Central does not calculate TACoS. You have to compute it yourself by cross-referencing ad data with total revenue — which requires exactly the kind of integrated analytics Seller Central doesn't offer.
Target benchmarks (US marketplace, Sponsored Products):
Amazon FBA Fee Complexity in 2026 (And Why Your Margins Are Wrong)
Amazon has updated its fee structure multiple times in the past three years. The January 2026 changes included:
FBA fulfillment fee increases averaging $0.08 per unit (standard size, US)
Updated Low-Price FBA Fees replacing the Small and Light program
New size-tier adjustments affecting dimensional weight calculations
Continued refinements to Inbound Placement Service fees
The brutal reality: if your analytics don't update fee tables automatically, your margin calculations drift silently. A calculation that was accurate six months ago may be wrong today.
Here's what a complete fee accounting looks like for a standard product in 2026:
Most sellers using Seller Central reports are missing between 8 and 15 of these fee types in their profitability model. On a $48,000/month business, a 3% error in fee accounting is $1,440 per month — $17,280 per year in invisible profit leakage.
Multi-Marketplace Analytics: The Blind Spot of Global Sellers
If you're selling on multiple Amazon marketplaces — US, India, UK, Germany, UAE, Japan, Canada, Australia — you already know the pain: separate dashboards, separate currencies, separate fee structures, and no native way to see your business as a whole.
But there's a deeper issue than inconvenience. A product profitable in the US might be actively losing money in Germany due to:
Higher FBA fees in European fulfillment centers
VAT and import duty structures that compress margins
Lower average selling prices in certain categories
Higher return rates in European markets (especially apparel and electronics)
Different referral fee percentages by category per marketplace
Blended P&L — adding up revenue across all marketplaces without separating margin by region — hides these differences. You might believe a product is performing well globally when it's subsidizing its own losses in two marketplaces.
For Indian sellers specifically, the analytics complexity compounds:
Easy Ship vs FBA vs Self-Ship have meaningfully different fee structures and zone-based logistics costs
18% GST applies to services received from Amazon India, affecting net settlement calculations
Closing fees apply to specific categories with tiered structures
USD/INR conversion for global sellers adds reporting complexity
What Advanced Amazon Profit Analytics Looks Like
Advanced Amazon profit analytics is not a shinier version of Seller Central. It's a fundamentally different layer of intelligence that answers questions Seller Central never can.
Here's what it actually looks like in practice:
1. Per-ASIN P&L in real time — Every product has a live profit calculation: revenue, all Amazon fees deducted automatically, COGS subtracted, ad spend attributed, returns modeled. You see CM1, CM2, and CM3 per unit. The numbers update throughout the day — not once every 24–72 hours.
2. Automatic fee accuracy — Fee tables update automatically with every Amazon change. You don't recalibrate manually after a fee announcement. The system tracks 40+ fee types and attributes them correctly to each ASIN.
3. TACoS visibility alongside ACoS — Both metrics displayed side by side, with profit-weighted ROAS and break-even ACoS calculated per SKU using real fees and COGS — not theoretical averages.
4. Unified multi-marketplace dashboard — All marketplaces in a single view, with currency conversion handled automatically. Profit by marketplace, contribution margin by region, fee comparison across fulfillment centers.
5. Proactive alerts — Notifications when a product's margin drops below a defined threshold, when a campaign's TACoS exceeds target, when return rate on an ASIN trends upward, or when inventory approaches stockout before it becomes a problem.
6. Historical trend analysis — Unlike Seller Central's 60-day detailed report window, advanced analytics stores and models long-term trends — seasonality patterns, fee impact timelines, and margin trajectory over 12–24 months.
This is what Sellerview.ai is built to deliver: profit analytics that goes beyond what Seller Central's basic reports can show, purpose-built for Amazon FBA sellers who need clear per-ASIN profitability — not just gross revenue figures.
How to Build Your Amazon Analytics Stack
Different seller stages need different tools. Here's an honest breakdown:
Under $9,600/month revenue
At this scale, Seller Central plus a manual COGS spreadsheet works with discipline. The priority is building the habit of tracking true unit economics before you scale a losing product.
Free tools worth using:
Amazon FBA Revenue Calculator (for pre-purchase sourcing math)
Brand Analytics Search Query Performance (Brand Registry required)
Amazon's native Profit Analytics Dashboard (launched 2025; no advertising data, but useful baseline)
Known limitation of Amazon's free Profit Analytics Dashboard: It launched in late 2025 and covers basic profitability — but it has zero advertising data. If you're running PPC campaigns, the free tool shows half the picture. TACoS is invisible.
$9,600–$60,000/month revenue
At this stage, manual tracking breaks down and the cost of bad data exceeds the cost of a good tool. The priorities:
Profit tracker with COGS integration: Connects to Seller Central via SP-API, pulls all fee data automatically, lets you enter COGS, and calculates true margin per ASIN. Options in this space include Sellerboard (profit-first, strong fee accuracy), SellerMetrics, and purpose-built platforms like Sellerview.ai.
PPC analytics with margin context: Most sellers at this stage run ACoS targets that don't account for actual unit economics. A profit-connected advertising analytics layer prevents overspending on campaigns that are technically "hitting ACoS targets" but actively eroding margin.
Inventory reorder tracking: At this revenue level, a 2-week stockout on a flagship ASIN is a $12,000–$36,000 revenue hole. Forecasting reorder points is not optional.
$60,000+/month revenue
At scale, the cost of data delay and margin leakage compounds dramatically. Sellers outgrow Seller Central's reporting reliably around $50,000 in monthly revenue.
The analytics stack for serious scale:
Near-real-time profit tracking with hourly data refresh — not 24–72 hour lagged reports
Contribution margin tracking at CM1/CM2/CM3 with fee accuracy above 99%
Multi-marketplace consolidation with currency normalization
Automated margin alerts and anomaly detection
Historical data storage beyond Amazon's native retention windows (60-day detailed reports)
The right mindset: The most successful sellers don't use one all-in-one tool that does everything adequately. They build a focused stack: a dedicated profit tracker, a focused PPC optimizer, and a separate research tool. Each does its job at a higher level than any single platform could.
The Profit-First Framework: 5 Questions Your Analytics Should Answer Daily
Whether you're using a spreadsheet or a full analytics platform, these are the five questions your data system should be able to answer every morning:
1. Which of my ASINs are actually profitable today? Not by revenue rank. By true margin after COGS, all fees, and ad spend. If you can't answer this within 60 seconds, your analytics system is failing you.
2. What is my TACoS across all active campaigns? Target: below 20% for growth phase, below 15% for mature products. If you don't know your TACoS, you don't know if your advertising is profitable.
3. Which products have declining margins month-over-month? Margin erosion is rarely sudden. It's usually a slow slide: fees increase a little, ad costs creep up, conversion rate drops slightly, return rate ticks up. The sellers who catch this early fix it. The ones who catch it late have a problem product with stale inventory.
4. What's my inventory health? Any aged stock approaching fee thresholds? FBA storage fees accelerate after 181 days. Aged inventory surcharges hit at 271 days. If you're not tracking this proactively, you're paying fees that were entirely avoidable.
5. Which marketplace is my most profitable — not just my highest revenue? Revenue by marketplace is easy to see. Profit by marketplace is what you actually need. The answer often surprises sellers.
Frequently Asked Questions
Does Seller Central show true profit?
No. Seller Central shows revenue and some fees but does not calculate true profit. It's missing COGS, PPC costs at the product level, inbound shipping, and promotional discounts. The Payments report shows fees, but you need to manually calculate profit margins — which requires combining data from at least four separate report types.
What is TACoS and why does it matter more than ACoS for Amazon sellers?
TACoS (Total Advertising Cost of Sale) divides ad spend by total revenue — organic plus paid. ACoS only divides ad spend by ad-attributed revenue. For mature products with significant organic sales, ACoS can look healthy while TACoS reveals the advertising is consuming a large share of overall revenue. TACoS is the accurate measure of advertising's true cost to your business.
How often should Amazon analytics data update?
For sellers doing $48,000+ per month, hourly data refresh is the minimum standard for operational decisions. Seller Central's 24–72 hour lag means a PPC campaign that starts overspending Monday morning isn't visible until Wednesday or later. Near-real-time data (updated every 1–4 hours via SP-API) is what serious analytics platforms provide.
What FBA profit margin should Amazon sellers target?
Healthy true margins — after all fees including advertising and returns — typically range from 15–25% for successful FBA sellers. Below 10% is high-risk: one fee increase or return spike can push you negative. Above 25% is strong; above 35% is exceptional and often indicates a proprietary product with limited competition.
What is the difference between ACoS and break-even ACoS?
ACoS is what your ads currently cost relative to ad-attributed revenue. Break-even ACoS is the maximum ACoS at which you can still make a profit on ad-driven sales, calculated using your actual product margin after COGS and all Amazon fees. Most sellers find their true break-even ACoS is 10–20% lower than they assumed — meaning campaigns that appear profitable by ACoS benchmarks are actually operating at a loss.
Is Amazon's free Profit Analytics Dashboard (launched 2025) sufficient?
It's a useful starting point for new sellers. For anyone spending $4,800+ per month on advertising, it isn't. The critical limitation: Amazon's native Custom Analytics tool has zero advertising data. With no PPC costs included, you're seeing revenue minus some fees — not true profit. The TACoS blind spot it creates can cost real money at scale.
What Amazon analytics tools work best for Indian FBA sellers?
Indian sellers need analytics that handles: India-specific fee structures (Easy Ship slabs, ₹300 threshold logic, closing fees by category), 18% GST on Amazon service fees, INR currency tracking, and multi-fulfillment-method comparison (FBA vs Easy Ship vs Self-Ship). Generic global analytics tools often miss these India-specific cost structures entirely, producing inaccurate profit calculations for the IN marketplace.
The Bottom Line
Amazon Seller Central is a transaction system that produces reports. It was built to process orders — not to run your business intelligence.
The sellers winning on Amazon in 2026 are not the ones with the most revenue. They're the ones with the clearest picture of where every dollar of profit comes from — and where it's leaking. They know their true margin per ASIN, not their gross revenue. They track TACoS, not just ACoS. They get alerts when margins erode, not monthly surprises when they audit their P&L.
Going beyond Seller Central's basic reports isn't a luxury for large sellers. It's the baseline operational requirement for running a profitable Amazon business in a marketplace where fee complexity, PPC cost inflation, and category competition make revenue growth meaningless without margin discipline.
Revenue is vanity. Profit is sanity. Analytics is the difference between the two.