
You Found a Supplier $2 Cheaper Per Unit. Your FBA Calculator Just Got Worse
Your current supplier charges $12 per unit. You found one at $10. You ran it through the FBA calculator. Margin went from 18% to 25%. You switched.
Three months later, your return rate climbed from 7% to 16%. Your star rating dropped from 4.3 to 3.8. Conversion rate fell. You started spending more on ads to maintain the same sales velocity. Margin collapsed to 11%.
The FBA calculator showed you the saving. It did not show you the cost of the saving.
This is the sourcing trap most Amazon sellers fall into at some point. Lower supplier price looks like a direct margin gain on paper. But supplier price is only one input in a much larger equation. Your FBA calculator cannot factor in quality-driven return rates, conversion rate impact from review score changes, or the ad spend increase needed to compensate for falling organic velocity. You have to model all of it before the switch makes sense.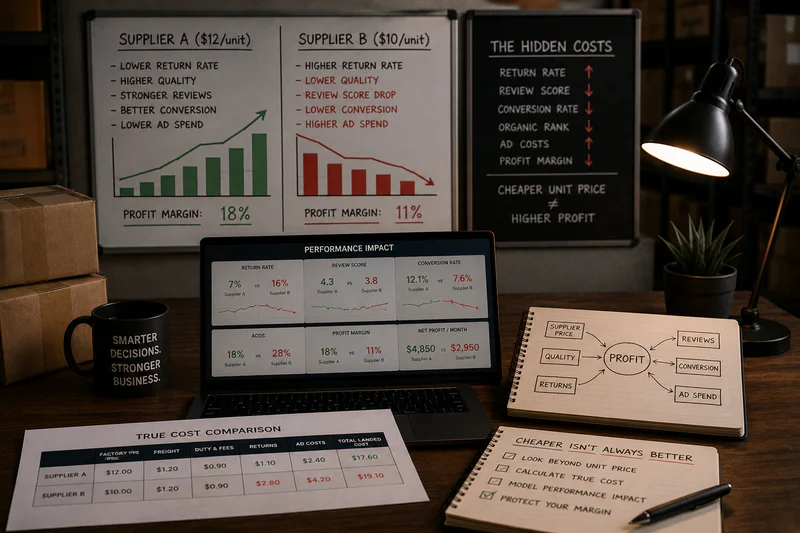
What Your FBA Calculator Sees vs What Actually Changes When You Switch Suppliers
Here is the gap. Your FBA calculator takes three inputs: selling price, COGS, and Amazon fees. When you switch to a cheaper supplier, COGS drops. Everything else in the calculator stays the same. The output looks better.
But "everything else" in the real world does not stay the same. Changing your supplier changes:
• Product quality : which affects return rate, review score, and customer complaints
• Packaging consistency : which affects whether the product arrives undamaged and whether customers feel they got what they expected
• Lead time reliability : which affects your inventory days of supply and exposure to low-inventory-level fees
• MOQ requirements : which affects how much capital you tie up per order and your per-unit freight cost
• QC rejection rate : which affects how many units never make it to FBA and how much of your COGS is absorbed by unsaleable stock
None of these variables appear in your FBA calculator. They show up later - in your return rate report, your review score, your Payments report, and your ad spend dashboard. By the time you see them, you have already committed to the new supplier and potentially sent 2-3 shipments.
The FBA calculator models a single clean sale with no returns, no conversion impact, no ad spend change, and no quality drift. Real sourcing decisions affect all five.
The Full Cost Equation Your FBA Calculator Needs Before Any Supplier Switch
Before you switch suppliers to save on COGS, run this five-variable equation. The FBA calculator gives you variables 1 and 2. You have to estimate the rest.
Variable 1: The Actual COGS Saving Per Unit
Start with the headline saving - the difference in factory price. If current supplier is $12 and new supplier is $10, the saving is $2 per unit at the factory gate. But remember: landed COGS changes with every shipment. If the new supplier ships from a different port, uses different packaging dimensions that push you into a larger FBA size tier, or requires a smaller MOQ that inflates your per-unit freight cost - the $2 saving may shrink to $0.80 or disappear entirely by the time the product lands at Amazon.
Variable 2: Return Rate Impact
This is the most undermodeled variable in every sourcing switch decision. If your current supplier delivers a 7% return rate and the cheaper supplier delivers a 14% return rate - the cost difference is significant. On a $35 product selling 500 units per month: at 7% returns (35 units), your return cost at $14 per return is $490/month. At 14% returns (70 units), your return cost doubles to $980/month - an additional $490 per month in losses, or $0.98 per unit sold. Your $2 COGS saving just became $1.02.
And that is before the FBA return processing fee, which for apparel and shoes equals the full FBA fulfillment fee on every returned unit. A cheaper supplier that drives higher returns can eliminate the COGS saving entirely and add net costs.
Variable 3: Conversion Rate and Review Score Impact
A product at 4.3 stars converts at a meaningfully higher rate than the same product at 3.8 stars. Below 4.0 stars is a conversion cliff on Amazon - you lose Buy Box priority weighting, ad click-throughs drop, and organic visibility falls. If your quality switch drops your rating from 4.2 to 3.8 over 3 months, you are now spending 20-30% more in ad spend to generate the same revenue. On a product with 12% TACoS, a 25% increase in ad spend intensity moves TACoS to 15% and cuts net margin by 3 percentage points. Run that through your FBA calculator and the supplier saving is gone.
Variable 4: Inventory Reliability and Low-Stock Fee Exposure
A cheaper supplier often means longer lead times, higher QC rejection rates, or less predictable shipping schedules. If your current supplier delivers in 25 days and your new supplier averages 40 days with higher variability, you will periodically drop below 28 days of supply and trigger the low-inventory-level fee - $0.30-$0.90 per unit sold. On a 500-unit-per-month SKU, one stockout-adjacent month costs $150-$450 in low-inventory fees alone. That is a recurring cost your FBA calculator never modelled.
Variable 5: QC Rejection and Unsellable Unit Rate
Cheaper suppliers often have higher defect rates. If your current supplier produces 1% defective units and the cheaper one produces 4%, that 3-percentage-point increase means 15 additional unsellable units per 500-unit order. At $10 COGS each, that is $150 in inventory write-off per order. Add the cost of a third-party inspection ($150-$300 per shipment) that you now need because quality control is less predictable - and your per-unit true cost is rising, not falling.
FBA Calculator Before vs After - The Real Sourcing Switch Math
Here is what happens to a $35 product selling 500 units per month when you switch from a $12 supplier to a $10 supplier with lower quality:
The cheaper supplier added $0.93 in effective COGS per unit and cut net margin by 7 percentage points. The $2 factory price saving cost $3.70 in downstream losses. Your FBA calculator showed 25% margin with the new supplier. Your actual margin was 11%.
When Switching Suppliers Does Make Sense
Not all supplier switches are margin traps. Here is when the math genuinely works:
• Same factory, different trading company: If the cheaper supplier sources from the same manufacturer, quality and lead times will be identical. The saving is real. Verify factory directly - many trading companies on Alibaba source from the same 2-3 factories.
• Manufacturing move to Vietnam or India: With Section 301 tariffs still applying to most Chinese goods in 2026, moving sourcing to Vietnam or India can save 10-25% in combined factory price and duty - enough to absorb some quality variance and still come out ahead.
• Same quality, lower MOQ: If the new supplier produces at the same quality but allows smaller orders, you reduce capital tied up per shipment and improve per-unit freight economics through more frequent, right-sized orders.
• Supplier upgrade, not downgrade: The most profitable sourcing switch is usually not the cheapest supplier - it is a better supplier at the same price point whose quality drives down return rate and improves review score, increasing organic velocity and reducing ad dependency.
How to Run a Full Sourcing Switch Decision Through Your FBA Calculator
Before switching suppliers, run this five-step evaluation. If the math still works after step 5, the switch is worth making.
• Step 1: Get a quality sample from the new supplier and run a side-by-side product comparison. Do not evaluate on spec sheets alone. Physical inspection reveals packaging quality, material consistency, and finish - all of which predict return rate.
• Step 2: Request references from other Amazon sellers using this supplier. Ask specifically about return rates and defect rates, not just delivery times.
• Step 3: Calculate the real landed cost saving - factory price difference minus any freight change, duty change (if origin country changes), or MOQ-driven freight allocation increase.
• Step 4: Estimate the return rate impact. Add 3-5 percentage points to your current return rate as a conservative assumption for a new supplier. Run that through your FBA calculator using the real return cost formula from your last 3 months of Payments data.
• Step 5: If after steps 3 and 4 the full-equation saving is still positive (not just the factory price saving), and the supplier passes quality inspection, the switch is viable. If the full-equation saving is negative or near zero, stay with your current supplier and negotiate price instead.
sellerview.ai tracks your return rate, ad spend per unit, and real net margin per SKU - so when you are evaluating a supplier switch, you start from real numbers instead of estimates.
Your FBA Calculator Shows One Variable. Sourcing Moves Five.
The FBA calculator is not wrong when it shows a margin improvement from a lower COGS. It is showing you what happens if nothing else changes. But something always changes when you switch suppliers.
Return rates change. Review scores drift. Ad spend adjusts. Inventory reliability shifts. Defect rates move. These five variables collectively determine whether the sourcing switch that looked profitable on paper actually made you more money.
Run the full equation before you switch. Get samples. Check references. Calculate the full landed cost change, not just the factory price difference. And never use a supplier switch to fix a margin problem that exists because of high ad spend, high return rates, or an FBA size tier issue - those problems follow the product, not the supplier.
sellerview.ai tracks your real net margin, return rate, and TACoS per SKU - so sourcing decisions start from data, not estimates. See your real numbers
free to start : Sellerview.ai
Try your free Amazon Profit Calculator
FAQ: FBA Calculator and Sourcing Decisions
Does a lower supplier price always improve my FBA calculator margin?
No. Your FBA calculator shows margin improvement only because COGS drops - it does not model return rate changes, conversion rate impact, or ad spend changes that often follow a supplier quality downgrade. A $2 COGS saving that drives a 7-percentage-point return rate increase and a 3-percentage-point ad spend increase can cost $3-5 per unit in downstream losses, completely eliminating the saving and reducing overall margin.
How do I calculate the real cost of switching to a cheaper Amazon FBA supplier?
Calculate five variables: the actual landed COGS saving (factory price difference minus freight and duty changes), the return rate cost impact (estimated new return rate × cost per return, minus current return rate × cost per return), the ad spend impact (estimated TACoS change × monthly revenue), the QC write-off rate (estimated defect % increase × COGS per unit × monthly units), and any low-inventory fee exposure from longer or less predictable lead times. Subtract all downstream cost increases from the COGS saving to get the real per-unit impact.
When does switching to a cheaper supplier actually improve Amazon FBA margins?
When the quality is identical (same factory, different trading company), when the origin country change saves on import duties (Vietnam or India vs China saves 10-25% combined), or when the new supplier allows a smaller MOQ that reduces capital tied up per order without changing quality. The best sourcing switches are not the cheapest supplier - they are a supplier at the same price that produces fewer defects and lower return rates, improving organic velocity and reducing ad dependency.
How do return rates affect my FBA calculator profit calculation?
Return processing fees in 2026 equal the full FBA fulfillment fee on every returned apparel or footwear unit, and $1.78-$11.35+ per unit above category thresholds for other categories. A product with $35 selling price moving from 7% to 14% return rate loses an additional $490/month on 500 units sold - equal to $0.98 per unit in permanent margin erosion. Your FBA calculator does not include this. You have to add return rate allocation manually using actual return cost data from your Payments report.
How can I check if a cheaper supplier will maintain product quality before switching?
Request physical samples and compare them against your current supplier product side-by-side. Pay for a third-party quality inspection at the factory ($150-$300 per inspection) before committing to a production order. Ask the supplier for references from other Amazon sellers - specifically ask about return rates and defect rates, not just lead times. If possible, start with a small test order (minimum viable quantity) and run it for 60-90 days before fully switching, tracking return rate and review score changes carefully.