
You Are Committing $8,000 to a Product Based on a Calculation That Is Missing Four Numbers
The purchase order is ready. 500 units. $16 landed cost. Minimum order. You ran the fba calculator. Margin looked like 22%. You are ready to send the wire.
Stop. That 22% is almost certainly wrong.
After working with 300+ Amazon brands across categories like Home & Kitchen, Beauty, and Electronics, the pattern is always the same: sellers commit capital based on a fba calculator run that looks like a complete model but is missing at least 3 of the 7 numbers that actually determine whether a product works. They find out which numbers they missed 90 days after launch - when the margin in their Payments report looks nothing like the number that convinced them to source.
This post is the model. Seven specific numbers. Where to get them. What thresholds they need to hit. No purchase order until all seven are in.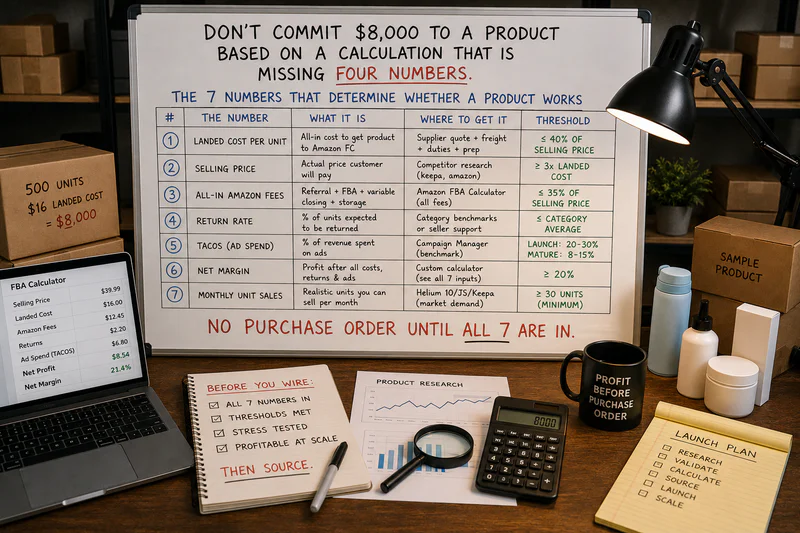
What Is Pre-Launch Profit Modelling for Amazon FBA?
Pre-launch profit modelling is the process of building a complete per-unit economics model in your fba calculator - using real or conservatively estimated inputs for all costs - before committing capital to a product. A pre-launch model is complete only when it includes landed COGS, market-realistic sell price, full 2026 FBA fees, TACoS-based ad spend, category return rate, capital requirements, and a days-to-profitability estimate. It is not the same as running the fba calculator with just selling price, supplier quote, and referral fee.
Why the Standard FBA Calculator Run Is a Fiction Before You Source
Here is what goes into a standard fba calculator run before sourcing:
• Selling price: the market average, or the price you want to hit
• COGS: the supplier quote - usually the FOB factory price
• FBA fee: auto-calculated based on category and estimated dimensions
• Referral fee: correct by category
Here is what gets left out:
• Inbound placement fee: $0.40/unit standard minimal split - not in most calculators
• 3.5% fuel and logistics surcharge: applies to all standard-size FBA from April 2026
• Ad spend: almost always entered as zero or ignored
• Return rate cost: never in the default calculator
• Full landed cost: freight, import duty, broker fees, prep, and insurance on top of FOB
• Low-inventory-level fee: $0.30-$0.90/unit if restock cadence drops below 28 days
Six missing variables on a fba calculator run that shows 22% margin. Add them back in and the real number is often 9-12%. That is the gap between a product that looks fundable and a product that is actually fundable.
The fba calculator does not lie. Your inputs do. And you will not find out until you are staring at a Payments report 90 days after you committed $8,000 to inventory.
The 7 Numbers Your FBA Calculator Needs Before You Commit
Number 1: What is my fully landed COGS - not my supplier quote?
Landed COGS is factory price plus every cost between the factory gate and the Amazon FBA shelf. For products sourced from China, that means:
A $10 FOB product frequently lands at $14-$17 per unit by the time it reaches Amazon. Enter $10 in your fba calculator and every margin output is fiction.
Number 2: What is the price the market will actually pay - not what I want to charge?
Pull the top 20 ASINs for your target keyword. Find where 60-70% of total page-one revenue is concentrated. That price band is your market constraint. If your landed COGS requires a $52 sell price to hit 20% margin but the dominant price band is $32-$45 - the math does not work. Enter the dominant price band in your fba calculator, not your aspirational price.
Number 3: What are the actual 2026 FBA fees - including the ones most calculators miss?
Use the full 2026 fee stack:
• Referral fee: 8-15% by category (apparel 17% for items over $15)
• FBA fulfillment fee: 2026 rates by size tier and weight band
• Inbound placement fee: $0.40/unit standard minimal split, $0 for Amazon-optimized multi-location
• Fuel and logistics surcharge: 3.5% on standard-size products from April 17, 2026
• Low-inventory-level fee: $0.30-$0.90/unit if your restock cadence will drop below 28 days
Most free fba calculators include referral and fulfillment only. The other three fees are manual additions. Miss them and your pre-launch model understates costs by $0.70-$1.30/unit.
Number 4: What is the realistic ad spend for my category at launch?
Enter zero ad spend in your fba calculator and you have a gross margin estimate - not a net profit estimate. In 2026, every new product needs ad spend to build velocity, reviews, and organic rank. Use these category TACoS benchmarks for the first 90 days of launch:
Convert TACoS to a per-unit dollar cost: TACoS % x selling price = ad spend per unit. Enter this in your fba calculator. Do not enter zero.
Number 5: What is the return rate for my category and what does one return actually cost?
Most fba calculators do not include returns. That is only acceptable for books, grocery, and supplements (2-7% return rates). Every other category needs a return allocation. Use these category benchmarks:
• Home & Kitchen, Pet: 8-12% return rate, $6-8 cost per return
• Electronics, Tech: 15-20% return rate, $10-14 cost per return
• Apparel, Fashion: 20-28% return rate, $7-10 cost per return
• Beauty, Health: 4-10% return rate, $5-7 cost per return
Return cost per unit = category return rate x real return cost. For apparel at 22% return rate with $8/return cost: $0.22 x $8 = $1.76 per unit sold. Add this to your fba calculator cost stack.
Number 6: What capital do I need and what does it cost me to hold this product?
Capital is not free. Inventory tied up in stock for 60-90 days before you recoup it has a real cost - either the interest on a credit line, the opportunity cost of not deploying it elsewhere, or the storage fees that compound while units sit. A product with a 90-day sell-through cycle at $14,000 in initial inventory ties up $14,000 for 90 days. If you are funding this with a credit line at 18% annualised, that is $630 in financing cost - or $1.26 per unit on 500 units. Small. But real. And it belongs in your fba calculator model.
For products with slow velocity or high seasonal concentration, add a storage allocation. Standard-size off-peak storage runs $0.78/cubic foot/month. Q4 peak runs $2.40/cubic foot/month. Estimate your expected hold time and add it to the model.
Number 7: When does this product actually break even - and can I survive until then?
Days-to-profitability is the number most pre-launch models skip entirely. It matters because launching a product with a $5,000 initial investment that takes 9 months to break even is a very different business decision than one that breaks even in 45 days.
Estimate days-to-profitability by dividing your total launch investment (inventory + ads in the first 30 days + shipping and prep) by your projected daily net profit at mature TACoS. For a $12,000 launch investment at $60/day net profit at maturity, break-even is 200 days. That is 6.5 months of cash tied up before the product pays for itself. Does your cash flow support that? If not, this product needs a smaller initial order or a higher margin to be viable for your business.
Your free Amazon Profit Calculator
The FBA Calculator Pre-Launch Pass/Fail Table
Run all 7 numbers through your fba calculator. Apply this threshold test before any purchase order:
The 20% minimum is not conservative - it is structural. A product at 20% net has room to absorb one fee increase, one return rate spike, or one ad cost increase before it goes below 10%. A product at 13% net has no room. One bad month and it loses money.
Run Two Models, Not One
One fba calculator run is not enough. Before committing, run two models:
Launch model (Days 1-90): Use launch TACoS (your category benchmark above), a sell price 5-8% below market average (accounts for launch pricing and early promotions), and return rate at 1.2x your category benchmark (new listings get more unfamiliar buyers). This is what the product will actually produce in the first quarter.
Mature model (Day 91+): Use mature TACoS (lower - 8-12% for most categories), market average sell price, and category benchmark return rate. This is what the product produces once it has reviews, organic rank, and ad efficiency.
The product passes if: launch model shows break-even or above AND mature model shows 20%+ net. If the launch model shows deep losses and the mature model shows 25% net - you need to validate that the TACoS trajectory assumption is realistic for your category and that you have the cash to fund the loss period.
Commit Capital Only When All 7 Numbers Are in Your FBA Calculator.
Every number you leave out of your pre-launch model is a surprise you will find in your Payments report 90 days from now. And surprises in your Payments report are never pleasant.
Seven numbers. Landed COGS, market price, 2026 FBA fees, TACoS, return rate, capital cost, and days-to-profitability. All of them in. Two models - launch and mature. Pass/fail at 20% mature margin minimum.
That is a pre-launch profit model. Not a fba calculator run with the supplier quote and a hopeful sell price.
sellerview.ai tracks all seven of these variables per SKU automatically once a product launches - so you move from pre-launch model to live validation in real time. See your real numbers
free to start : https://sellerview.ai/
FAQ: FBA Calculator and Pre-Launch Profit Modelling
What is pre-launch profit modelling for Amazon FBA?
Pre-launch profit modelling is the process of building a complete unit economics model in your fba calculator before placing a purchase order. A complete model includes fully landed COGS (not just factory price), market-realistic sell price, all 2026 FBA fees including placement and fuel surcharge, category TACoS at launch rate, category return rate, capital holding cost, and days-to-profitability estimate. The model passes when the base case shows 20%+ net margin and break-even is achievable within your cash flow timeline.
What numbers do I need in my FBA calculator before committing to a product?
You need seven numbers: (1) fully landed COGS including freight, duties, broker fees, and prep; (2) dominant market price for your category, not your aspirational price; (3) full 2026 FBA fees including inbound placement fee ($0.40/unit standard) and 3.5% fuel surcharge; (4) category launch TACoS as your ad spend estimate (12-22% depending on category); (5) return rate allocation using category benchmarks (8-28% depending on category); (6) capital cost and storage allocation for your expected sell-through period; and (7) days-to-profitability calculated from total launch investment divided by projected daily net profit at maturity.
What net margin should my FBA calculator show before I source a product?
Your fba calculator base case - with fully landed COGS, realistic sell price, all 2026 fees, category TACoS, and category return rate - must show at least 20% net margin before you commit capital. At 20% net, the product can absorb a fee increase, a return rate spike, or an ad cost increase without going negative. Below 15% net at base case, the product fails the pre-launch test. Typical healthy Amazon FBA margins in 2026 range from 15-25% net, with private label sellers targeting 25-30%.
How do 2026 Amazon fee changes affect my FBA calculator pre-launch model?
Three 2026 changes materially affect pre-launch fba calculator models that were built on older fee assumptions. First, the 3.5% fuel and logistics surcharge took effect April 17, 2026 - this applies to all standard-size FBA and increases per-unit fulfillment cost by $0.10-$0.25 depending on your size tier. Second, Amazon eliminated FBA prep and labeling services on January 1, 2026 - add $0.15-$0.50/unit for external prep. Third, inbound placement fees remain in effect at $0.40/unit for minimal splits. Any pre-launch model built before these changes is understating costs by $0.65-$1.15/unit.
How accurate is the Amazon FBA calculator for pre-launch modelling?
Amazon's free FBA Revenue Calculator is accurate for the inputs it includes - referral fees and FBA fulfillment fees. But it does not include inbound placement fees, the fuel surcharge, ad spend, return rate costs, or the full landed COGS chain. It is a useful starting point for fee estimation only. For a complete pre-launch profit model, you need to manually add those missing components - or use a tool that tracks your full cost stack automatically. A fba calculator run that produces a number without all seven inputs is directionally useful but not a reliable basis for a sourcing decision.
How do I calculate days-to-profitability for my Amazon FBA calculator model?
Days-to-profitability = Total launch investment / Daily net profit at mature product economics. Total launch investment includes: inventory cost (MOQ x landed COGS), ad spend in the first 30 days (launch TACoS x estimated first-month revenue), and shipping and prep costs. Daily net profit at maturity = (monthly revenue x mature net margin %) / 30. For a $12,000 launch investment and $60/day net profit at maturity, days-to-profitability is 200 days. If your cash flow cannot support a 200-day recovery window, reduce your MOQ or find a higher-margin product.