
Why Your ACoS Looks Fine But Your Business Is Losing Money (Without an FBA Fee Calculator)
Your ACoS is 18%. The campaign dashboard is green. You feel like you've figured it out.
You probably haven't.
ACoS measures exactly one thing: what percentage of ad-attributed revenue went to advertising. That's the whole formula - Ad Spend ÷ Ad Revenue × 100. It doesn't know your FBA fees. It doesn't know your cost of goods. It ignores referral fees, storage costs, and return rates entirely.
This is why thousands of Amazon sellers run a 20% ACoS and still lose money every month - and why running an fba fee calculator to establish true unit economics before touching any bid isn't optional. It's foundational.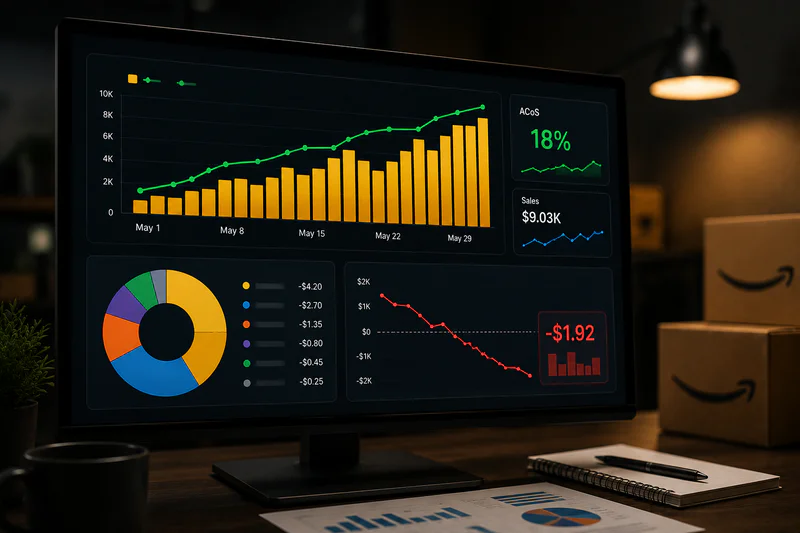
The Math That Exposes the Illusion
Take a product selling at $29.99. Your ACoS is 20%, meaning you spent $6 in ads to generate that sale. Sounds efficient. Here's where that $29.99 actually went:
FBA fulfillment fee: $5.32 (standard size, ~1 lb)
Referral fee (15%): $4.50
COGS (landed): $9.00
Inbound shipping allocation: $1.20
Monthly storage per unit: $0.45
Total non-ad costs: $20.47
After fees and COGS, you have $9.52 left. Subtract your $6 in ad spend: net profit is $3.52. That's 11.7% margin.
Now drop the price to $24.99 with the same cost structure. Non-ad costs barely shift - maybe $19.80. Before ads, you have $5.19. At 20% ACoS ($5 in spend), your net is $0.19 per unit. One return wipes out 20 sales worth of profit.
Your ACoS looks identical in both scenarios. Your business health is completely different.
The Real Problem: No Break-Even Baseline
Most sellers set ACoS targets from benchmarks or intuition. "Keep it under 25%" is standard advice. But 25% ACoS means entirely different things on a $14.99 product versus a $49.99 one.
The number you actually need is break-even ACoS - the highest ACoS at which you don't lose money on an ad-attributed sale.
Break-even ACoS = (Selling Price − COGS − FBA Fees − Other Variable Costs) ÷ Selling Price × 100
On a $29.99 product with $20.47 in non-ad costs, break-even ACoS is 31.7%. Your 20% ACoS is fine - you actually have room to be more aggressive and capture more volume.
On a $24.99 product with the same cost structure, break-even ACoS drops to 20.8%. Suddenly your "good" 20% ACoS is barely profitable, and any campaign inefficiency pushes you negative.
You can't calculate break-even ACoS without running a proper fba fee calculator on each ASIN. Most sellers skip this entirely.
The Three Fee Layers Sellers Consistently Miscalculate
1. Fulfillment Fees
Amazon measures weight and dimensions after packaging - not before. If your product is 12 oz but ships in a box that bumps it past a size tier threshold, you could pay $1.50–$2.50 more per unit than you estimated. That single discrepancy swings break-even ACoS by 5-8 points on a mid-range product.
2. Referral Fees
Most categories charge 15%, but it varies significantly. Clothing is 17%. Electronics accessories drop to 8% above $100. Grocery sits at 8%. If you haven't verified your category's exact rate, your margin math is wrong - sometimes by 2–3 full percentage points before ads even enter the picture.
3. Storage Fees
Monthly storage rates run $0.78/cubic foot (Jan–Sep) and spike to $2.40/cubic foot (Oct–Dec). A slow-moving SKU holding 90 days of inventory in Q4 can accumulate $3–$5 in storage per unit before a single sale closes. That cost is invisible in your ACoS dashboard but very real in your P&L.
TACoS Is Better - But Still Not the Full Picture
Some sellers have moved to TACoS (Total Advertising Cost of Sale): ad spend ÷ total revenue, not just ad-attributed revenue. That's a better signal because it captures the organic sales halo from advertising activity.
But a 10% TACoS can coexist with a money-losing operation when unit margins are thin enough. TACoS doesn't know your FBA fees. Neither does ACoS. Neither metric replaces knowing your net profit per unit - calculated fresh, with current fees, against each ASIN's actual sell price.
Fix This in Under Two Hours
Here's a practical process for any catalog under 50 ASINs:
Pull your top 20 ASINs by ad spend from the last 30 days
Run each through an fba fee calculator - capture fulfillment fee, referral fee, and storage cost per unit
Add landed COGS (product + inbound freight + prep)
Calculate break-even ACoS using the formula above
Compare actual ACoS from Seller Central against break-even for each ASIN
Any ASIN where actual ACoS exceeds break-even is generating losses on every ad-attributed sale. That's not a bidding problem - it's a pricing or cost problem. Fix it before adjusting campaigns.
In most catalogs, 3–5 ASINs absorb disproportionate ad spend at negative margins. Identifying and fixing those - through repricing, cost negotiation, or pausing - typically improves total profitability without touching your best performers at all.
What Sellers Running Healthy Businesses Actually Track
Sellers running healthy businesses at scale don't stare at ACoS dashboards daily. They track:
Net profit per unit by ASIN, updated monthly or when fees change
Break-even ACoS recalculated after every fee update or COGS shift
TACoS trend over 90-day windows - weekly data is too noisy to act on
Contribution margin per ASIN: revenue minus all variable costs (fees + COGS + ad spend)
ACoS is a useful lever for campaign optimization. It's a poor signal for business health. Treat it accordingly - and run the fee math first.
FAQ
What is break-even ACoS and how do I calculate it?
Break-even ACoS is the maximum ad spend percentage at which an ad-attributed sale still produces zero profit - not a loss. Calculate it as: (Selling Price − COGS − FBA Fees − Other Variable Costs) ÷ Selling Price × 100. Any ACoS below this number means ad sales are profitable; above it, every ad-attributed sale is a loss.
Why does my ACoS look good but my profits are dropping?
ACoS only measures ad spend against ad-attributed revenue - it ignores FBA fulfillment fees, referral fees, storage costs, and COGS entirely. If your unit economics are thin, a "good" ACoS can still produce negative net margins. Run an FBA fee calculator on your top ASINs to find your real margin before drawing any conclusions from ACoS alone.
How often should I recalculate FBA fees for my ASINs?
Recalculate whenever Amazon announces a fee update (typically once or twice a year), when you change product packaging or dimensions, or when inventory starts accumulating long-term storage fees. A $0.50 fee increase on a $15 product is a 3-point ACoS swing - enough to flip a profitable ASIN into a per-unit loss.
What is the difference between ACoS and TACoS on Amazon?
ACoS measures ad spend as a percentage of ad-attributed revenue only. TACoS measures ad spend as a percentage of total revenue, capturing the organic sales lift from advertising. TACoS is a better business health metric, but neither accounts for FBA fees or COGS - you need per-unit margin math alongside both.
Can a 20% ACoS still be unprofitable?
Yes. On a low-margin product, even a 15% ACoS can produce negative net profit. A $14.99 product with $12 in combined fees and COGS has a break-even ACoS of roughly 13% - so 20% is actively losing money on every ad-attributed sale. Break-even ACoS varies entirely by product, and the only way to know it is to run the fee math first.