
Most Sellers Think They're Profitable. Their P&L Says Otherwise
Amazon FBA is worth it in 2026 if your selling price is above $25, your net margin after every cost — COGS, referral fee, FBA fulfillment, ad spend, storage, and returns — is above 15%, and your product has a differentiated reason to exist. Below those thresholds, Amazon's fee structure will compress your margin to the point where you are working for Amazon, not for yourself.
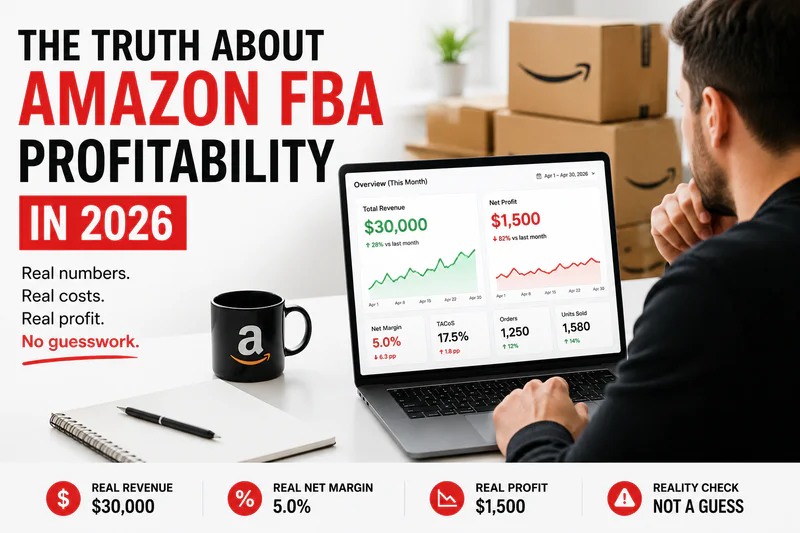
You look at your revenue number and it feels like progress. $30,000 this month. Highest ever. You run a quick back-of-envelope: selling price, minus what you paid your supplier, minus Amazon's fees. Comes out to roughly $8,600 in profit. You feel good about it.
Then you sit down and do the actual numbers. You forgot ad spend — that was $5,250 at 17.5% TACoS. Returns ate another $600. Storage fees from your slow-moving variants cost $400. And your landed COGS was 12% higher than your invoice cost once you added freight and duties — another $850 you never counted. Your actual profit was $1,500 on $30,000 in revenue.
That is a 5% net margin. On $30,000. That is not a business. That is a very expensive job with no benefits.
This happens because most sellers answer "is Amazon FBA worth it?" with revenue data, not P&L data. This post answers it with P&L data — the real numbers, the full 2026 cost stack, and the specific conditions under which FBA is worth it and when it is not.
Key Takeaways
The majority of Amazon sellers are profitable — Jungle Scout's seller research has historically put it as high as ~89% — but only about half clear a 15%+ net margin. The gap between those two numbers is the sellers who think they're profitable until they model every cost.
Amazon's combined fees (referral + FBA fulfillment) consume 25–35% of revenue before COGS or advertising even enters the picture. Most sellers underestimate this by 8–10 percentage points.
A healthy Amazon FBA net margin is 15–20%. Above 25% is excellent. Below 10% means one fee change or return-rate spike puts you negative.
TACoS — not ACoS — is the correct metric for deciding if FBA is worth it. ACoS looks at ad spend vs. ad sales. TACoS looks at ad spend vs. all sales. They tell completely different stories.
Products priced under $20 are structurally very hard to make profitable through FBA. Fixed fulfillment fees alone eat 25–35% of a sub-$20 selling price before referral, COGS, or ads. The math rarely works.
1. The Full Amazon FBA Fee Stack in 2026

Amazon's fees in 2026 typically consume 25–35% of your selling price before COGS or advertising. If your gross margin (selling price minus COGS) is below 50%, FBA is already structurally difficult.
This is where most sellers make their first mistake. They run the numbers on referral fee and FBA fulfillment fee, see a number they can work with, and proceed. Then the real costs show up.
Every fee you need to include, with 2026 rates:
Low-Price FBA note: Items priced under $10 qualify for Low-Price FBA fulfillment rates — roughly $0.86/unit cheaper than standard. It softens the blow on budget items, but as you'll see in the ASP floor test, fixed fees still crush sub-$10 economics.
The total Amazon fee load for most FBA sellers runs 30–40% of revenue once you add referral, fulfillment, the fuel surcharge, storage, and placement together. Your gross margin — selling price minus COGS only — needs to be at least 55–60% for FBA to have a chance of being profitable after ads. Below that, the unit economics rarely work.
2. The Real Amazon FBA P&L: A Worked Example
This is the P&L most articles refuse to show you. Not a range. Not "15–20% net." The actual numbers for a real product at a realistic price point, with every 2026 cost included.
Product: Home & Kitchen item, selling at $32 on Amazon US. Small standard size (~14 oz). 500 units/month. Running PPC at a 15% TACoS target.
This works. 23.8% net at $32 with properly controlled ad spend and a realistic COGS. Now watch what happens when variables drift one at a time — and how fast a healthy margin becomes a fragile one.
Scenario 2: Same product, same starting price. TACoS drifts to 22% (common for sellers not tracking it actively). Return rate climbs to 15% (apparel-adjacent product). The next fee cycle adds $0.50 to fulfillment. Then a competitor undercuts you and you drop to $30 to hold Buy Box share.
Each step looks survivable on its own. Stacked, they take you from a 23.8% margin to 10.6% — less than half — without you doing anything obviously wrong. That is the chain of events that turns a working FBA business into a stressful one. None of these moves are dramatic. That is exactly why sellers miss them until the settlement report arrives.
Track every layer of this P&L by SKU in real time. Sellerview's profit analytics shows you CM1, CM2, CM3, and net margin per product automatically — including TACoS, not just ACoS.
3. Amazon FBA Profit Margins by Category in 2026
Amazon FBA profit margins in 2026 range from ~10% net (high-competition, low-ASP categories) to 30%+ net (differentiated private label in lower-competition categories). The benchmark for a sustainable FBA business is 15–20% net after all costs.
These are ranges, not guarantees. Your actual margin depends on your specific COGS, how well you control TACoS, your return rate, and whether you manage inventory tightly enough to avoid storage penalties. The category gives you the ceiling. Your operations determine where you land inside that range.
4. The 3-Filter FBA Profitability Test

Before launching any product on FBA — or before deciding whether to continue with an existing one — run it through these three filters. If it fails any one of them, the product is not ready for FBA.
After managing Amazon P&Ls for 300+ brands through Adsify, the pattern is consistent: unprofitable FBA products fail one or more of these three filters. Every time.
Filter 1 — The Gross Margin Gate
Your gross margin — selling price minus landed COGS, before any Amazon fees — must be above 55% for FBA economics to work. Below 55%, Amazon's 30–40% fee load plus 10–20% ad spend leaves you negative before you have counted returns or storage.
Formula: Gross Margin = (Selling Price − Landed COGS) ÷ Selling Price × 100
If your sell price is $32 and your landed COGS is $9.50, your gross margin is ($32 − $9.50) ÷ $32 = 70.3%. That passes the gate. If your sell price is $25 and your landed COGS is $13, your gross margin is 48%. That fails. Do not proceed without renegotiating COGS or raising price.
Filter 2 — The ASP Floor Test
FBA fulfilment fees are largely fixed per unit based on size and weight, not percentage-based. This means at low selling prices, those fixed fees become a catastrophic percentage of revenue.
Fulfillment fees above assume a mid-weight small-standard unit and include the 3.5% fuel surcharge. Sub-$10 items qualify for Low-Price FBA (~$0.86/unit cheaper), but even with that discount the fixed-fee burden stays north of 40% of price.
The US minimum viable ASP for FBA profitability is approximately $25. Below $20, it is nearly impossible to make the math work unless your COGS is extraordinarily low.
Filter 3 — The TACoS Reality Check
Before launch, estimate your steady-state TACoS. Talk to an agency or experienced seller in your category. If the category typically requires 20%+ TACoS to stay on Page 1 and your gross margin after fees is 30%, you are left with 10% gross before COGS. That is not a business.
The TACoS reality check: Is (Gross Margin After All Fees) − (Target TACoS %) − (Return Rate Allocation %) still above 15%?
If yes: proceed. If no: fix either COGS, sell price, or category before launching. Use Sellerview's free FBA Profit Calculator to run this check before you source a single unit.
5. When Amazon FBA Is NOT Worth It
This is the section every other article skips. FBA is not worth it in every situation. Here are the specific conditions where FBA will cost you more than it earns you.
Your selling price is under $20. The fee structure does not work below this threshold in most categories. FBA fulfillment fees eat 25–35% of selling price before referral fees, COGS, or ads are considered. If your market's price point is under this floor, either differentiate into a higher price point, bundle products to raise ASP, or use FBM with a 3PL that can still get 2-day delivery.
Your gross margin before fees is under 55%. If your COGS is high relative to your selling price, FBA's fixed costs make the unit economics structurally broken. Amazon's fees do not care whether you are making money. They come off the top every time. Get your gross margin above 55% before FBA makes sense.
Your product has a return rate above 15%. Every return costs you: Amazon refunds the referral fee but keeps a 20% administration cut, charges a return processing fee, and if the item is damaged you lose the COGS entirely. At a 15%+ return rate, your effective margin is 5–10 points lower than your P&L shows. Apparel, shoes, and electronics are the worst categories for this. Model your category return rate before launch — Sellerview's performance alerts flag when your return rate spikes beyond your baseline.
Your inventory turns slowly (under 4x per year). Slow-moving inventory pays storage fees every month. In Q4, those fees triple. Products that sit in Amazon's warehouses past 180 days get hit with the Aged Inventory Surcharge on top. If your annual inventory turns are below 4x, you are paying Amazon to store your product while it erodes your margin. Either increase velocity through better ads and pricing, or switch to FBM and store inventory at a 3PL where storage costs a fraction of Amazon's rates.
You are competing primarily on price. If the only reason a customer buys you over the next seller is price, you are in a race to the bottom that FBA's fixed fee structure cannot survive. FBA works for products with enough differentiation to hold a price floor. Generic me-too products in saturated categories at a competitive price point almost always end in margin destruction. You need a defensible position.
6. How to Fix a Broken Amazon FBA P&L
If your FBA P&L is broken — margin below 10%, TACoS out of control, returns eroding profit — there are four levers. You need to pull at least two of them meaningfully to recover.
Lever 1: Reduce Landed COGS
Renegotiate with your supplier. Move to a lower-cost manufacturer. Optimize packaging to drop into a smaller FBA size tier — a 1-inch reduction in dimensions can shift you from Large Standard to Small Standard and cut fulfillment fees by $1.50–$2.00 per unit. Remove unnecessary packaging that adds weight and cubic footage. Every $1 off COGS raises your margin by $1 per unit. It is the highest-leverage move available.
Lever 2: Control TACoS, Not Just ACoS
ACoS looks fine when organic sales are growing. TACoS reveals the truth. If your TACoS is creeping above your target, the problem is usually one of three things: wasted spend on non-converting search terms, campaigns running without negative keyword hygiene, or bids set at the right level 60 days ago but wrong now. Optimize every 14 days. Not daily — daily is immature data. Not monthly — monthly is too slow. Fourteen days. And always measure TACoS, not just ACoS. Sellerview tracks your TACoS per SKU by default.
Lever 3: Cut Slow Movers
Every variant that turns fewer than 4x per year is a storage fee liability. Every SKU with a negative net margin is subsidised by your profitable ones. Pull up your SKU-level P&L and identify the bottom 20% by net margin. Liquidate, remove, or improve those products. The sellers who stay profitable on Amazon are not the ones who scale indiscriminately. They are the ones who cut fast and scale what works.
Lever 4: Raise Your Price Floor
Most sellers are underpriced relative to the value they deliver. A $2 price increase on a $30 product is 6.7% more revenue with near-zero incremental cost. If your conversion rate holds, your profit per unit increases by $2 and your margin improves by 6–7 percentage points. Test price increases before you accept margin compression from competition. Your price floor should be calculated from your real cost stack, not from what competitors are doing. Run your numbers through the Sellerview FBA Profit Calculator to find your exact floor.
7. Frequently Asked Questions
Is Amazon FBA still profitable in 2026?
Yes, for sellers who run the numbers correctly before launching. The majority of FBA sellers are profitable according to Jungle Scout's seller research — but only about half clear a 15%+ net margin, and far fewer survive once every fee and ad cost is modeled correctly. The sellers who are not profitable typically failed to model TACoS, return rates, or the 2026 fee updates accurately. FBA profitability is not guaranteed — it is the result of choosing the right product, controlling costs, and tracking margin at the SKU level.
What is a good Amazon FBA profit margin in 2026?
A good FBA profit margin is 15–20% net after all costs: COGS, referral fee, FBA fulfillment fee, the 3.5% fuel surcharge, storage, inbound placement, advertising (at TACoS, not ACoS), and returns. Above 25% net is excellent and gives you room to absorb fee increases. Below 10% net is a warning sign — one cost spike pushes you negative.
What percentage does Amazon take from FBA sellers?
Amazon's combined fees (referral + FBA fulfillment) typically consume 25–35% of your selling price before COGS or advertising. Referral fees alone are 8–15% depending on category. FBA fulfillment fees add 10–15% more, plus the 3.5% fuel surcharge introduced in April 2026. Storage, placement, and return fees add further. Total Amazon fee load for most sellers is 30–40% of revenue.
What is the Amazon FBA success rate?
Jungle Scout's seller surveys have historically shown the large majority of sellers reporting profitability, with over half reporting net margins above 15%. Success rates vary significantly by business model: private label sellers with differentiated products succeed at higher rates than sellers of generic products in saturated categories. The success rate is not about FBA itself — it is about whether you picked the right product and manage your economics correctly.
What selling price do I need for FBA to be profitable?
The minimum viable selling price for FBA in the US is approximately $25 for most categories. Below $20, fixed FBA fulfillment fees consume 30–35% of selling price before referral fees, COGS, or ad spend. Sub-$10 items get Low-Price FBA rates (~$0.86/unit cheaper), but the fixed-fee burden still makes the math break for most sellers.
Should I use ACoS or TACoS to measure FBA profitability?
TACoS. Always. ACoS measures ad spend against ad-driven sales only. TACoS measures ad spend against total sales — including organic. A seller with 20% ACoS might have 35% TACoS if organic sales have collapsed. TACoS is the metric that tells you whether your advertising is building your business or just renting traffic. ACoS tells you about campaign efficiency. TACoS tells you about business health. Use both, but make decisions with TACoS.
How do I track my real Amazon FBA profit margin per SKU?
Use a dedicated profit analytics tool that pulls Seller Central data and calculates net margin per SKU including TACoS, return-rate allocation, and actual fee data. Spreadsheets break the moment you have more than 10 SKUs. Sellerview tracks this automatically with real-time alerts when margin drops on a specific product. Start with the free FBA Profit Calculator to model your numbers before connecting your account.
Your revenue number is not your profit number.
Every seller knows their revenue. Very few know their true net margin per SKU after every cost is accounted for. The sellers who scale profitably on Amazon in 2026 are not the ones with the best products or the biggest ad budgets. They are the ones who track their real P&L — CM1 through CM3 — and cut underperformers before they drag down the business.
Check your real numbers right now with the free Amazon FBA Profit Calculator. Or connect your Seller Central account and see every SKU's net margin, TACoS, and profit-leak breakdown in one place with a free Sellerview trial.