
You Ran the Revenue Calculator Amazon Once. You Got a Good Number. That Is Not a Stress Test
You found a product. You ran it through the revenue calculator Amazon tool. Referral fee: $5.25. FBA fee: $4.20. COGS: $9.50. Selling price: $38. Net margin: 25%. You feel good about this.
You have not stress-tested anything. You have run one optimistic scenario.
Professional Amazon sellers - the ones who consistently launch products that work - reject 70% of ideas based on revenue calculator results. But they do not run a single calculation. They run three: a best case, a base case, and a worst case. The product only proceeds if the worst case is still survivable.
In 2026, with Amazon FBA fee increases averaging $0.08 per unit, a 3.5% fuel surcharge added in April, and import duties stacking at 30-45% for Chinese goods, the gap between best case and worst case is wider than it has ever been. A single revenue calculator Amazon run at best-case inputs is not a business decision. It is wishful thinking.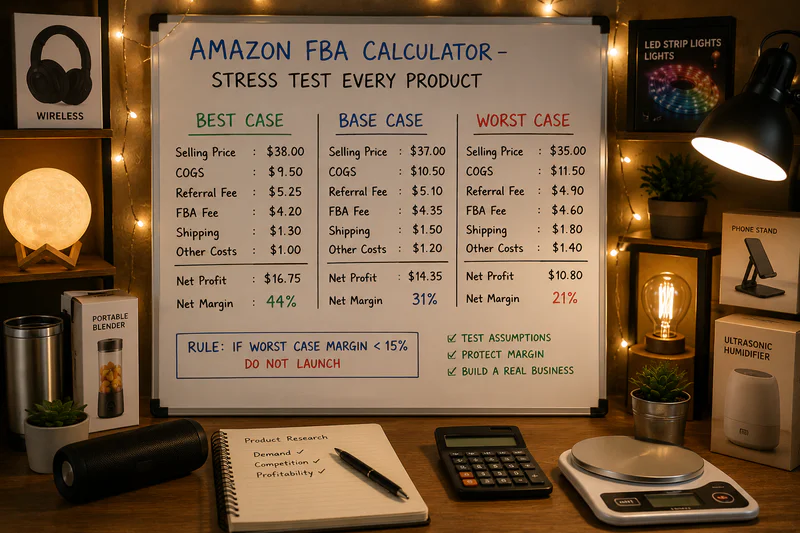
Why a Single Revenue Calculator Amazon Run Produces an Optimistic Number
Here is what a standard revenue calculator Amazon run does. You enter:
• Your selling price at the market average (not the lowest competitor price)
• Your COGS at the supplier quote (not the fully landed cost after freight and duties)
• FBA fees auto-calculated (often missing placement fees, fuel surcharge, or low-inventory fees)
• Ad spend at zero or a guess (not a real TACoS estimate for your category at launch)
• Return rate at zero (not your category benchmark)
Every one of those inputs is best case. Stack five best-case inputs and you get a number that will never appear in your actual Payments report. The market does not deliver best-case on all five variables simultaneously. Something always goes worse than expected in the first 90 days - usually ad spend, return rate, or the sell-through price after launch discounts.
The revenue calculator Amazon gives you a number. Stress-testing gives you a range. The range is what you actually need to make a sourcing decision.
Stressed about number? Give a try to Amazon Profit Calculator
The 3-Scenario Revenue Calculator Amazon Stress-Test Framework
Run every product idea through three scenarios before you commit capital. The same product. The same revenue calculator Amazon tool. Three different input sets.
Scenario 1: Best Case
This is the number you usually see on your first run. Use it as the ceiling, not the target.
• Selling price: market average for the dominant price band on page one
• COGS: supplier FOB quote - not fully landed (this is intentionally optimistic for this scenario)
• FBA fees: standard 2026 rates for your size tier
• Ad spend: 10% TACoS - a mature, well-optimised product with strong organic
• Return rate: 5% - below-average for most categories
Best case gives you the theoretical ceiling. If best case shows under 20% net margin, stop. The product does not have enough room to absorb any variance. If best case shows 25%+, proceed to base case.
Scenario 2: Base Case
This is what a realistically successful launch looks like after 90 days. Use this as your go/no-go decision point.
• Selling price: 5-8% below market average to account for launch pricing, promotions, and competitive adjustments
• COGS: full landed cost - factory price plus freight ($1.50-$3.00/unit), duties at your HTS rate, broker fees ($0.40-$0.60/unit), prep ($0.15-$0.50/unit)
• FBA fees: full 2026 stack including inbound placement fee ($0.40/unit standard)
• Ad spend: category benchmark TACoS for a 90-day launch - typically 14-18% for most categories
• Return rate: category benchmark - 8-12% for home and kitchen, 15-20% for electronics, 20-25% for apparel
Base case is your realistic outcome. If base case shows 15%+ net margin, the product is viable. If base case shows 10-15%, it proceeds only with a clear path to COGS improvement or price optimisation. Below 10% base case - walk away.
Scenario 3: Worst Case
This is the revenue calculator Amazon run that most sellers never make. It is the most important one.
• Selling price: 15% below market average - models a price war, a dominant competitor drop, or your inability to hold price at launch
• COGS: full landed cost at unfavorable freight rates (add 30-40% to your freight estimate for rate volatility)
• FBA fees: maximum for your size tier, including low-inventory-level fee ($0.30-$0.90/unit) if you expect supply chain delays
• Ad spend: 20-25% TACoS - high competition launch with poor early organic pull
• Return rate: 1.5-2x your category benchmark - a product that underperforms on reviews in the first 60 days
Worst case tells you the floor. If worst case produces negative margin - the product cannot survive a bad launch, a fee increase, or a competitor price drop. That is not a risk you can manage. That is a binary: the product will either work or it will cost you money. If worst case shows break-even or above - the product has structural resilience. Even in a bad scenario, you are not losing money. That is the product worth sourcing.
Revenue Calculator Amazon - The 3-Scenario Output on a $38 Product
Here is how the same product looks across all three scenarios:
The single revenue calculator Amazon run showed 37.6% margin. The base case shows 11.9%. The worst case shows a loss of $7.07 per unit. That is not a safe product to source with a 500-unit minimum order - a worst-case launch costs $3,535 in losses before you can adjust.
A seller who only ran best case would source confidently. A seller who ran all three scenarios would negotiate COGS below $9.50 (perhaps to $7.50 landed by optimising freight and sourcing from Vietnam instead of China) until the base case shows 18%+ and the worst case shows break-even or above.
When Your Revenue Calculator Amazon Worst Case Still Clears
A worst-case negative number is not automatically a rejection. Context matters.
If worst case negative is driven primarily by a 25% TACoS assumption but the product has strong organic pull signals - high page-one keyword volume with fewer than 300 competing ASINs, multiple competitors converting at above 10%, keyword trend showing 18-month growth - then the high TACoS is a launch phase assumption, not a permanent state. If TACoS drops to 12% at month 4, the worst case becomes the base case, and the economics work.
If worst case negative is driven by a COGS problem - freight rates and duties are the culprit - then the question is whether the route can be restructured. Vietnam or India origin, Amazon-optimized inbound splits eliminating placement fees, or smaller and lighter packaging to drop a size tier.
Reject the product when: worst case is deeply negative AND none of the driving variables (COGS, sell price, ad spend) are within your control to change. Keep the product on the list when: worst case negative is driven by one specific variable that you can address before you source.
How to Build the 3 Revenue Calculator Amazon Scenarios in 20 Minutes
You need three data sources, all of which are accessible before you place an order:
• Category TACoS benchmarks: use the range from this blog - or pull from any major Amazon seller forum or data platform. Home and Kitchen: 12-18%. Apparel: 15-20%. Electronics: 15-22%.
• Category return rate benchmarks: pull from the return rates by category data in the sellerview.AI blog series, or use conservative estimates from your niche's top review complaints.
• Full landed COGS estimates: use supplier quote as FOB, then add standard freight ($2/unit ocean LCL), HTS-based duty rate from USITC, $0.50/unit for broker/port, $0.35/unit for inland, and $0.30/unit for prep.
Run the three scenarios in a spreadsheet or in your Amazon revenue calculator Amazon tool - three separate calculations, three separate outputs. The product proceeds if base case shows 15%+ net and worst case shows break-even or above.
Sellerview.ai tracks your real margin per SKU with actual 2026 fees, live TACoS, and real return rate - updated daily. Once a product launches, you move from scenario modelling to live validation immediately.
One Revenue Calculator Amazon Run Is a Hope. Three Scenarios Are a Decision.
The product idea that passes best case, base case, and worst case is worth sourcing. Everything else is a speculation funded by optimism.
70% of product ideas rejected by serious Amazon sellers are not bad product ideas. They are ideas that look good at best-case inputs and fall apart under base-case or worst-case assumptions. The revenue calculator Amazon tool did not lie to them. They only asked it one question instead of three.
Run all three scenarios. Make the decision on the worst case. If the worst case is survivable - source it. If it is not - keep looking.
sellerview.ai shows your real margin trajectory per SKU - so you move from stress-test scenarios to live validation the moment a product launches. Start stress-testing smarter
free to start : Sellerview.ai
FAQ: Revenue Calculator Amazon and Product Stress Testing
How do I stress-test a product idea using the revenue calculator Amazon tool?
Run three separate revenue calculator Amazon scenarios for the same product: best case (optimistic inputs - supplier FOB quote as COGS, market average sell price, 10% TACoS, 5% return rate), base case (realistic inputs - fully landed COGS, 5-8% below market sell price, category benchmark TACoS, category benchmark return rate), and worst case (pessimistic inputs - high freight COGS, 15% below market price, 20-25% TACoS, 1.5x return rate). Only proceed if the base case shows 15%+ net margin and the worst case shows break-even or above.
What is a realistic worst-case TACoS for a new Amazon product?
For a new product in a competitive category, worst-case TACoS runs 20-25% during launch. This accounts for high-bid campaigns needed to generate initial velocity, low organic conversion during the review accumulation phase, and potential bid increases if competitive sellers target your keywords. Most sellers assume 10-12% TACoS pre-launch. In practice, first-90-day TACoS for new products in competitive categories averages 18-22%. Use 25% for your worst case to stress-test with realistic downside.
How many scenarios should I run in my Amazon revenue calculator before sourcing?
Three - best case, base case, and worst case. Professional Amazon sellers reject 70% of product ideas based on calculator results, and they use scenario modelling, not single-point calculations. The best case tells you the ceiling. The base case is your go/no-go decision point (minimum 15% net). The worst case tells you the floor - if it is deeply negative with no fixable variable, do not source the product regardless of how good the best case looks.
How do I factor return rates into my revenue calculator Amazon stress test?
Use category benchmark return rates for each scenario: 5% for best case, your category benchmark (8-12% home and kitchen, 15-20% electronics, 20-25% apparel) for base case, and 1.5x the category benchmark for worst case. Calculate return cost per unit as: return rate × (refund amount + return processing fee + ad spend per sale). Multiply this per-unit return cost by units sold to get monthly return losses. Add this as a cost line in your revenue calculator Amazon stress test.
What should I do when my revenue calculator Amazon worst case shows a loss?
Identify which variable is driving the loss. If it is COGS (freight and duty), investigate whether the route or origin country can be optimised - Vietnam or India sourcing can save 10-25% on combined costs versus China. If it is the sell price assumption, check whether the product has enough differentiation to hold a premium. If it is TACoS, check whether keyword demand signals suggest strong organic potential. Only proceed if one specific variable is fixable. If all three are unfavorable and structural, find a different product.