
You closed last month at $84,000 in sales. Up 18% from the month before. You told your spouse it was a good month.
Then your accountant sends the quarterly numbers and your stomach drops. After ad spend, after the returns you forgot about, after a storage bill that somehow doubled, after the referral fees Amazon quietly takes off the top — you cleared 6%. On paper you grew. In your bank account, you barely moved. And the worst part: you can't point to where it went. The money just... evaporated.
That gap — between the revenue you celebrate and the profit you actually keep — is the most expensive blind spot in your business. This Sellerview review for 2026 is about whether one tool can actually find your P&L leaks, or whether it's just another dashboard charging you a monthly fee to confirm you're confused.
Key Takeaways
Your Seller Central reports surface only a fraction of the dozens of fee types Amazon charges. The missing ones are where margin quietly dies.
Blended TACoS is the single most dangerous metric on your dashboard — it hides unprofitable SKUs behind your hero products.
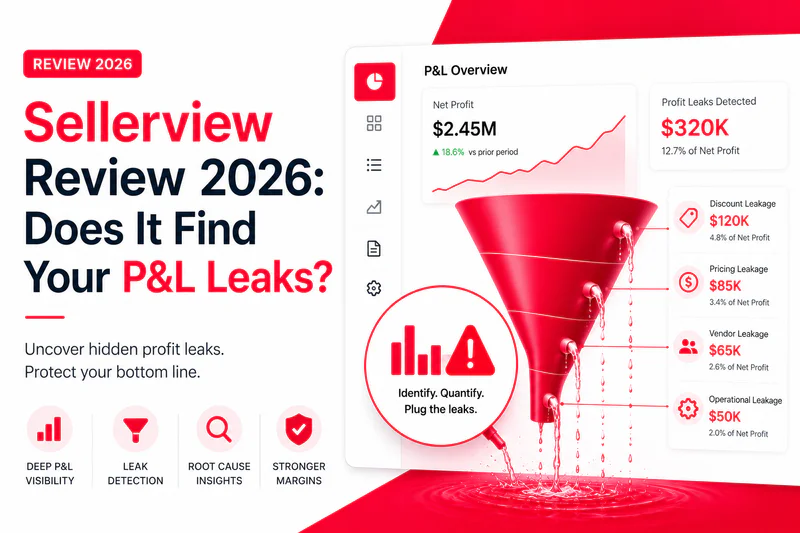
Sellerview is built for profit leak detection: SKU-level P&L, fee breakdowns, returns, and PPC profitability in one view. It's strong at finding leaks, weaker as an all-in-one ops suite.
The fastest profit win for most $10K–$500K/month sellers isn't more ad spend. It's plugging leaks you can't currently see.
Use the 5 Leak Zones framework below to audit your account in under an hour — with any tool, or none.
Why Your P&L Is Lying to You
Revenue is a vanity metric. You already know this in theory. The problem is structural: Amazon doesn't hand you a profit number. It hands you a settlement report with 200+ line items and lets you do the math — and most sellers never do.
Here's the formula nobody fully runs:
Revenue − Amazon fees − ad spend − returns − COGS = actual profit.
Most sellers track revenue and ad spend. They skip the other three. That's not laziness — it's that the data lives in five different reports that don't talk to each other, and reconciling them by hand eats a full day you don't have.
So you scale on gut. You see ACoS at 22% and feel fine. You see sales climbing and pour more into PPC. Meanwhile a return rate creeping from 4% to 9% on one SKU is bleeding you, and you won't notice for three months because returns hit your account on a delay.
The healthy benchmark, after every deduction, is a 20–25% net margin. If you can't tell me your number off the top of your head right now, you have leaks. Guaranteed.
The 5 Leak Zones: Where Amazon Money Actually Disappears
After managing ad spend across 300+ brands at Adsify, the leaks are not random. They cluster in five zones, every single time. This is the framework — the 5 Leak Zones — that any Amazon FBA profit analytics tool should be measured against.
Fee Leaks are bigger than you think
Amazon's referral fee ranges from 5% to 45% by category — most categories sit at 15% (per Amazon's published fee schedule). And while Amazon froze referral percentages in both 2025 and 2026, FBA fulfillment fees still rose by an average of $0.08 per unit in 2026 — small per unit, brutal at volume. Add inbound placement fees, the new fuel surcharge, and aged-inventory penalties, and total Amazon fees routinely consume 30–45% of an item's selling price before you've spent a dollar on ads. If your tool shows you one blended "Amazon fees" number, it's hiding the zone where you can actually cut.
PPC Leaks hide behind your winners
This is the one that gets sophisticated sellers. Your account-level TACoS vs ACoS both look acceptable. Underneath, 20% of your ad spend is going to SKUs that are unprofitable after fees and COGS — but a couple of strong performers in the same campaign mask the bleed. You only catch it when ad spend is allocated SKU by SKU and tied to that SKU's real contribution margin. Blended numbers will never show you this.
Does Sellerview Actually Find Your P&L Leaks? An Honest Review

Short answer: yes — for finding leaks, which is exactly what it's built to do. Let me be specific, because the internet is full of "Sellerview review 2026" and "Sellerboard review 2026" posts that are affiliate links wearing a review costume. They give every tool 4.8 stars and list "takes time to set up" as the only flaw. Ignore those. Here's the real breakdown.
Where Sellerview is strong
SKU-level P&L. This is the core. Instead of one blended profit figure, you see profit per product, per day — with Amazon fees, PPC, returns, refunds, promotions, and your COGS all subtracted. That directly attacks Leak Zones 1, 2, and 5. You stop guessing which products to scale and which to kill.
TACoS clarity. Sellerview separates the metric that fuels growth from the metric that's quietly killing margin. For a mature brand, healthy TACoS sits under 15%; for newer brands, 15–20%. Seeing it at the SKU level is where the PPC leaks finally surface.
Actionable over raw. The positioning is "not just another dashboard — simplified, actionable profit insights." In practice that means it points at the leak instead of dumping 200 rows on you and wishing you luck. For a seller doing $10K–$500K/month who doesn't have a full-time analyst, that's the difference between data you look at and data you act on.
Where the SERP's other reviews fall short — and where this differs
The top-ranking tool roundups compare dashboards, refresh speed, and pricing. None of them teach you a method to find leaks yourself, and none prioritize which leak to fix first by dollar impact. A tool that shows you everything but doesn't tell you the $4,000/month PPC leak matters more than the $300 storage leak is still leaving money on the table. Judge any Amazon profit tracker — Sellerview included — on whether it ranks your leaks by size, not just whether the dashboard is pretty.
The 60-Minute Leak Audit You Can Run Today

You don't need to buy anything to start. Run this audit against your last 90 days. A tool makes it continuous; doing it once manually makes it real.
Pull the fee report (15 min). Export your transaction-level fees. Group by fee type. Anything beyond referral and fulfillment — placement, storage, aged-inventory, returns processing — is a Fee Leak candidate. Flag the top three.
Allocate ad spend by SKU (15 min). For your top 10 SKUs by spend, calculate contribution margin after fees, COGS, and that SKU's ad spend. Any SKU negative after this is a PPC Leak. Cut or fix the bids.
Reconcile returns (10 min). Pull returns by SKU. Did the referral fee get credited back? Are units marked "returned" actually back in inventory? Gaps here are recoverable cash.
Audit reimbursements (10 min). Check for lost or damaged inventory events older than 30 days with no reimbursement. Industry estimates put unclaimed reimbursements at 1–3% of FBA revenue. File the claims.
Verify COGS (10 min). Is your landed cost current — freight, duties, the lot? Stale COGS makes a losing SKU look profitable. Update it.
Do this and you'll find money in the first hour. Every time. The question is whether you want to repeat it manually each month or let software watch it for you.
What Sellerview Doesn't Do (and Who Shouldn't Buy It)
No tool earns trust until it tells you what it isn't.
Sellerview.ai is Amazon-only. If you sell across Shopify, Walmart, and Amazon and want one P&L for everything, this isn't your tool — look multi-channel. It's a profit and leak-detection product, not a full operations suite: it won't replace a dedicated PPC bid-management platform or a deep inventory-forecasting engine. And if you're doing under a few thousand dollars a month with five SKUs, an honest spreadsheet still works — you don't have enough complexity to justify the subscription yet.
Who it's for: the seller doing $10K–$500K/month, running PPC, scaling on instinct, who suspects they're leaking but can't see where. That's the exact pain it was built around.
The Real P&L Math: A $50K/Month Example
Here's why this matters in dollars. A seller at $50,000/month who tracks only revenue and ad spend "feels" profitable. The full math tells a different story.
The seller thought they were at 25%. They're at 12.6% — and roughly $3,000 of that monthly gap is recoverable: the PPC losers, the missed reimbursements, the returns where the referral fee never came back. That's $36,000 a year sitting in plain sight, invisible until someone subtracts every line. Finding it is worth far more than the next 10% of ad budget.
FAQ
What is a P&L leak on Amazon? A P&L leak is any cost quietly eroding margin that you're not tracking — misclassified fees, unprofitable PPC, uncredited returns, or unclaimed reimbursements. They're invisible in Seller Central's default view and usually total 5–15% of revenue.
Is Sellerview better than Sellerboard? They overlap on profit tracking. Sellerview leans into simplified, action-first leak detection and SKU-level P&L; Sellerboard bundles more ops features like autoresponders. Pick based on whether you want focused profit clarity or a broader toolkit. Sellerview's 30-day free trial (no card required) lets you verify the fit before committing.
Does Sellerview show TACoS vs ACoS? Yes. It separates ACoS (ad efficiency) from TACoS (total ad impact on the business), and surfaces both at the SKU level — which is where unprofitable ad spend actually hides behind your winners.
How much profit do most sellers leak? Across accounts, leaks commonly run 5–15% of revenue. Unclaimed FBA reimbursements alone are estimated at 1–3% of FBA revenue, and SKU-level PPC waste often hits 10–25% of ad spend.
Can't I just use a spreadsheet? For a few SKUs, yes. Past 20–30 SKUs or meaningful ad spend, manual reconciliation across five Amazon reports becomes a full-time job you'll skip — and skipping it is the leak. Software makes it continuous.
Does Sellerview have a free trial? Yes — a 30-day free trial with no credit card required. You can also run the free profit calculator first to see your real margin before committing — start with the math, then decide if you want it watching your account daily.
See Your Real Profit
Stop guessing. Run your numbers through the Sellerview free profit calculator and see your true margin in minutes — or start your free 30-day trial (no card needed) and let it find the leaks for you, SKU by SKU. The first leak it finds usually pays for the year.