
Most sellers either obsess over BSR or completely ignore it. Both are wrong. BSR is one of the most misread metrics on Amazon - sellers use it to judge product health, validate sourcing decisions, and measure ad performance, often without understanding what it actually tells them (and what it doesn't).
What is BSR (Best Seller Rank)?
BSR, or Best Seller Rank, is a number Amazon assigns to every product that has made at least one sale. It tells you where that product ranks against all other products in its category, based on sales velocity. A BSR of #1 means that product is the top-selling item in its category right now.
The number is updated hourly and appears on every product detail page under "Product information." A lower BSR = more sales relative to competing products in that category. A higher BSR = slower sales.
Every category has its own BSR ladder. Your product can appear in a main category (like Home & Kitchen) and multiple subcategories simultaneously - giving it multiple BSR numbers.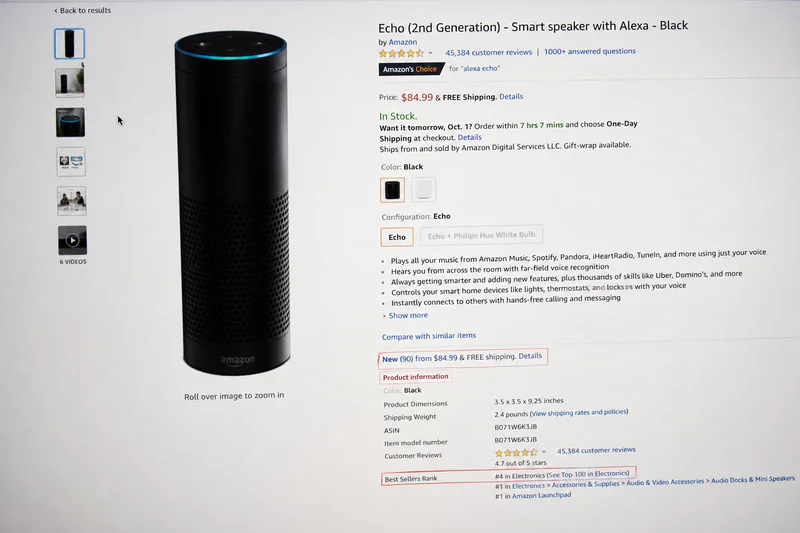
How BSR Works on Amazon
Amazon doesn't publish the exact algorithm, but from extensive testing across thousands of products, here's what we know:
BSR is a relative ranking, not an absolute sales count. It compares your sales to every other product in that category. If you sell 100 units today and your competitor sells 200, you rank below them.
The weighting favors recency - heavily. Amazon weighs recent sales far more than historical sales: last 1–3 hours carry the highest weight, yesterday's sales medium weight, last 7 days lower weight, and last 30 days the lowest. This is why a single flash sale or a viral moment can spike a BSR dramatically - then crash back down within 24 hours when the sales velocity drops.
BSR does not equal total units sold. A product selling 10 units/day in a tiny niche can have a better BSR than one selling 50 units/day in a hyper-competitive category. Context is everything.
Rough sales benchmarks (Home & Kitchen category)
BSR #100–500: roughly 200–500+ units/day. BSR #1,000–5,000: roughly 50–200 units/day. BSR #10,000–50,000: roughly 10–50 units/day. BSR #100,000+: fewer than 5 units/day. These numbers shift by category - always use category-specific estimators like Jungle Scout or Helium 10 for precise figures.
Why BSR Matters for Your Profitability
Here's what BSR actually tells a smart seller:
Market demand validation. Before launching a product, check the BSR of top competitors. If the #1 product in a category sits at BSR #50,000, the market isn't big enough. If it's at BSR #2,000, there's real demand.
Competitive benchmarking. Track your BSR trend over 30–60 days. A steadily improving BSR means your listing velocity is increasing relative to the market - even if absolute sales feel flat. A worsening BSR despite stable sales means the category is growing faster than you are.
Organic vs. paid health check. Run your BSR trend against your ad spend. If your BSR only improves when ads are on and tanks when they're off, you have no organic demand - only paid. That's a margin problem waiting to happen.
The profitability connection: BSR doesn't show profit. Two products at the same BSR can have wildly different margins. One is running at 8% net profit. The other is running at -3%, funded entirely by deep discounts and external traffic tricks. BSR shows sales velocity. It says nothing about your actual P&L.
Common Mistakes Sellers Make with BSR
Mistake 1: Using BSR snapshots to make sourcing decisions. A product's BSR right now could reflect a flash sale from three hours ago. Sellers see a BSR of #800 on a product and think it's a goldmine - without realizing that BSR was #12,000 for the past six weeks. Always look at BSR history (tools like Keepa show this for free). Judge the trend, not the moment.
Mistake 2: Comparing BSR across categories. BSR #1,000 in Kitchen & Dining is good but not exceptional. BSR #1,000 in Industrial & Scientific is incredible - almost no products in that category move that fast. Raw BSR numbers are meaningless without category context.
Mistake 3: Chasing BSR at the expense of margins. Heavy discounts, coupons, and giveaways will improve your BSR fast. They'll also destroy your profitability. Sellers run aggressive promos to hit a target BSR, burn through margins, then wonder why the business isn't growing. BSR is a vanity metric if your net margin is negative.
Mistake 4: Ignoring BSR after going out of stock. Going OOS even once can tank months of BSR progress. Amazon sees a drop in your sales velocity the moment you run out of stock. Once you restock, you're starting rank-recovery from scratch - and that can take 4–8 weeks to rebuild. OOS events are far more expensive than most sellers realize.
How to Use BSR the Right Way
Step 1: Research before launch. Pull the BSR of the top 10 products in your target category. Estimate monthly sales using Jungle Scout or Helium 10. If the top seller has a BSR indicating under 300 units/month, the category is too thin to scale.
Step 2: Track trends, not snapshots. Check your BSR at the same time each week. A 60-day downward trend (lower BSR = better) means your listing velocity is improving. If it's drifting up over 60 days, something is wrong - a competitor entered, your listing weakened, or your price is off.
Step 3: Set BSR milestones by category. For your specific category, identify what BSR corresponds to ~30 units/day, ~100 units/day, and ~300 units/day. These become your growth milestones. When you hit BSR X, you know you're at Y units/day - and you can work backward to the ad spend and conversion rate required to get there.
Step 4: Use BSR to validate ad performance. If you're spending $500/day on PPC and your BSR is still drifting upward, your ads are not generating enough incremental organic sales to offset what competitors are doing. Time to audit your targeting, bids, and listing conversion rate - not just spend more.
Step 5: Protect your rank around restock cycles. Plan inventory replenishment 8–10 weeks ahead. If your lead time is 6 weeks, reorder when you have 10 weeks of stock left. OOS events are BSR killers that most sellers treat as unavoidable - they're not.
How Sellerview Helps You Track BSR
Sellerview pulls in your sales data SKU by SKU, so you can correlate your BSR movement directly with profitability - not just revenue. You'll see what your rank is actually costing you.
The Bottom Line
BSR is one of the most useful signals on Amazon - if you know how to read it. It tells you sales velocity relative to your category, validates market demand before launch, and shows whether your organic traction is real or entirely ad-funded.
What it doesn't tell you: whether you're profitable, whether those sales are sustainable, or whether your margins can support the volume required to hold that rank. Use it as a directional compass, not a final verdict.
See your real profit behind every BSR on sellerview.AI - free trial at sellerview.AI